
Dating back to the 15th century, golf is one of the most traditional sports in the world. Even in its modern form, it continues to maintain most of its original characteristics and etiquette from centuries ago. However, golf has not been immune to the technological revolution that has seen many individual and team sports adopt the latest data technologies to optimise performance and enhance entertainment value for fans.
In today’s golf, every single aspect of the game, from a player’s swing to their round strategy and even the equipment they use is being transformed through scientific advances, data analysis, machine learning and cloud technologies. Impressively, this highly traditional sport has rapidly embraced data analytics as a means to provide a deeper understanding and enjoyment of the game. As a sport with one of the tightest of margins amongst its elite players, where one single dropped shot can cost you a tournament, golfers have turned to technology to develop an intelligent and information rich training regime and strategy to improve their chances of winning.
The Largest Golf Database By PGA Tour
One of the first developments that triggered the data revolution in golf dates back to 2003, when PGA Tour partnered with CDW to create an advanced ball-tracking system: ShotLink. The concept of ShotLink was first designed in 1983 as an electronic scorecard to catalogue historical data. However, technological advancements allowed CDW and PGA Tour to develop an improved system that aimed to break down every detail of every stroke taken by every player to facilitate the analysis of each player’s round and overall performance. The objective was not only to help players improve their game through data, but was also considered as an attempt by the Tour to help make the sport more accessible to modern players and fans.

Since its launch, ShotLink has dramatically evolved over the years to the point that it can now laser map each golf course and create a digital image of each hole to calculate exact locations and distances between any two coordinates, such as the location of all players and their distance to green. The system has been continuously upgraded in line with its increasing adoption by most of golf’s data ecosystem, through apps, devices, software and consultancy agencies available today.
One of the latest improvements PGA Tour has made to its data collection system is the installation of three fixed, high-resolution cameras that replaced the human-operated laser on every green to capture the ball in motion. Thanks to ShotLink, PGA Tour have managed to develop a database of 174 million shot attributes and 80,000 hours of video over the past 20 years in operation. But once the data had been collected, practical insights needed to be produced from the large number of individual data points gathered over the years. To make sense of such large dataset, they partnered with Microsoft to leverage artificial intelligence through Azure cloud-based services and create a Content Relevancy Engine (CRE) that processed ShotLink’s immense database to find the most relevant, most interesting stats that are contextual.

Today, ShotLink is used in 93 events per year. Its data feeds are accessed by broadcasters as well as top-flight players, who use the statistics from the system to analyse, compare their performance against competitors and improve their play. But not only players have benefited from the introduction of this high-tech system. Through ShotLink, PGA has managed to enhance viewers entertainment experience when watching the sport by making the ball highly visible through television.
The statistics captured through ShotLink have also been turned into into eye-opening insights that have increased the level of engagement from most golf fans. By having unprecedented data available for analysis, PGA Tour was able to uncover valuable insights relating to the different patterns of play amongst top PGA players. Some of these interesting insights included:
Winning players tend to make a higher number of putts between 11 and 20 feet away.
A third of all putts are over 20 feet of distance, with better golfers often leaving themselves 3 feet or closer on the first putt.
99% of PGA players make puts within 3 feet distance.
Top golfers rarely go three-putt or over.
Hitting the fairway means the PGA golfer will under par on the hole.
Top players average under par after hitting the rough, which adds 0.25 of a shot to the hole.
The most frequent approach shot distance range is 150-175 yards. From there, 71% of PGA golfers hit the green from the fairway; but need to be between 75-100 yards to hit 71% from the rough.
Golfers gain shot advantage instead of losing it if they aim 25, 30 or 35 yards back to avoid the rough or other hazards.
Golfers should always aim for the green instead of laying-up on a par 5 that has no water or hazards around the green. This allows them to hit their third shot from within 50 yards of the hole, increasing their chances of cutting their putting distance and error rates in half.
An improvement of a half-stroke per round increases a player’s earning potential by 73 percent.
Development Of Data Gathering Systems, Devices And Smart Equipment
The technological revolution in golf has brought new devices and systems that can now provide statistical analysis to enhance training, playing and viewing experience of the sport.
One of the most crucial and difficult aspects of golf is the swing. It is considered one of the most complex sequence of movements in any sport, with muscle groups of the whole body involved to provide the millimetric, biomechanical prerequisites to transfer the swing energy efficiently and accurately to the golf ball. Therefore, it is not surprising that swing sensors, grip guides, shot trackers, laser rangefinders, and even virtual caddies, that help inform and improve the swing in varying circumstances have increasingly become more predominant amongst professional and amateur golfers to help them achieve the perfect swing.

Some of these devices include systems like TrackMan or K-Motion, which monitor granular variations in motion using a combination of HD cameras and microwave transmissions that reflect back from a moving golf club and golf ball and capture data of what happens at the exact moment of contact with the ball. Others, such as inertial sensors and depth cameras for 3D analysis like Golf Integrated, have been used to evaluate the swing of golfers in relation to their joint length and initial posture. These systems are able to display many factors of the golfer’s swing, such as club head launch speed, distance carried and ball spin. With the captured movement, they provide expert interpretative biomechanical reporting on body, arm, hand and club motions, as well as balance and weight distribution, during each golf swing.
Additionally, systems that use highspeed, high-resolution cameras, such as Foresight Sports’ GC2 Smart Camera System, are also able to measure club performance and ball launch data, such as ball speed, total spin, launch angle, deviation angle and spin tilt axis, to determine the ball trajectory, peak height, angle, distance in relation to initial launch condition and total final distance including bounce and roll. In combination with Foresight Sports’ HMT Head Measurement Technology, Foresight’s Sports’ devices can measure the delivery of the club head in terms of path, face plane, closure rate, velocity and impact location of the golf ball. All these data points are intuitively displayed in Foresight Sports’ Performance Fitting app using illustrated depictions of ball flight and club head data.

Traditional golf equipment is also experiencing significant change with the incorporation of analytics and technology into its manufacturing. Cobra Golf’s KING F8 club lines developed clubs with connected smart grips powered by an embedded Arccos computer sensor that tracks and analyses a golfer’s performance through shot tracking, distance calculation and location. These clubs come with their own smartphone app that uses GPS to track positioning and displays multiple analytics on the golfer’s performance, such as strokes gained and handicap breakdowns for driving, approach, chipping, sand and putting. Golf balls are also getting smarter. Coach Labs’ GEN i1 and i2 smart golf ball and OnCore’s Genious Ball now contain nine-axis sensor and on-board MCU that acts like a miniature launch monitor to measure initial direction, speed, impact force and ball rotation during putting and direction, spin rate, distance and speed in full swing and transmits the data to a smartphone app.

Amateur players have also seen their golfing experience expand thanks to technology. For instance, recreational players can now enhance their playing skills and enjoyment of the game through systems such as virtual caddies. Arccos Golf developed an Arccos Caddie solution that uses wireless club mounted sensors that attach directly to the player’s golf clubs, as well as using GPS trackers from smartphones, to collect player performance data in real time. The system can track which clubs the player uses, where they hit the ball and how many shots it took to complete each hole, broken down into driving, approach, chipping, sand, and putting. Arccos Caddie uses Microsoft’s Azure Machine Learning to leverage artificial intelligence against the 120 million shot data and 368 million geotagged data stored in its system from 40,000 golf courses to provide golfers with specific advice on how far to hit each shot, which club to use and how to make corrections as they play their round. It also offers golfers their optimal strategy off the tee after considering their likely shot distance as impacted by wind, weather, elevation and other factors. It can also calculate for them their expected score and odds of making par, their likelihood of hitting the fairway, and their chances of missing to either side. For example, it can detect a player’s tendency to miss fairways to the left with the 3-wood, or even a glaring inability to hit the green with the 8-iron.
Generating Valuable Information By Contextualising The Data Collected
Sensors, GPS, cameras and other tracking devices are unable to paint a complete picture of a player’s performance without the underlying analytics to tell the story. Even though increasing amounts of raw data points, such as swing speed, can now be captured with these new devices, analytics is pivotal to generate value and context from such vast data.
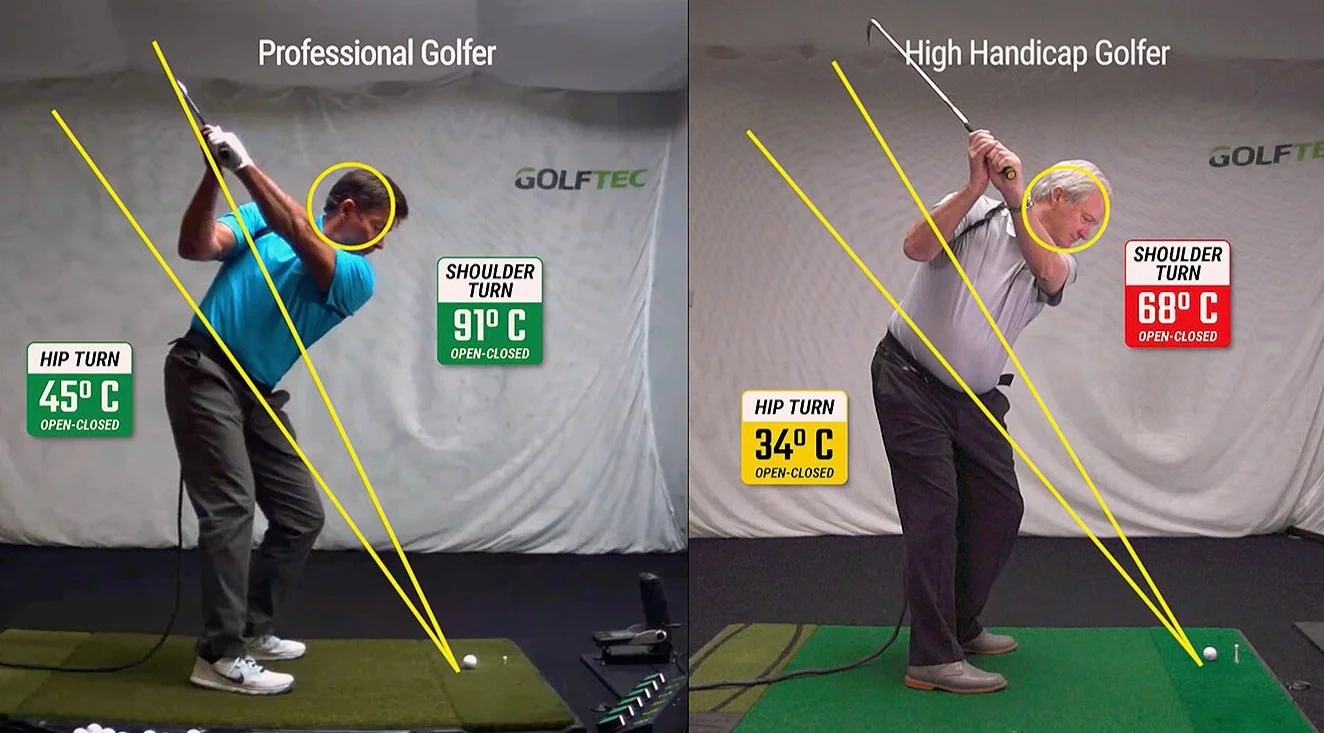
In 2017, GolfTEC tested 13,000 pro golfers and amateurs across 48 different body motions per swing using motion sensors, cameras and monitors in a study the labelled as SwingTRU Motion Study. The study aimed to define what makes a great golfer. They found that the difference between a competent golfer and a top one can be summarised in their hip sway and shoulder tilt at the top of the swing and then point of impact, as well as the hip turn at the point of impact and the shoulder bend at the finish of the swing. By statistically correlating these factors to better performance, GolfTEC developed a benchmark in which golfers can compare themselves in these different areas and make improvements.
Moreover, USGA is making use of its database of 2 million golfers and 50 million scores collected through the Golfer Handicap Information Network by developing an algorithm that creates a professional-style benchmarking ability at the recreational level to allow golfers at all levels to compare their game against others and gain insight into how they are playing. For example, this system enables amateur golfers to compare their Saturday’s round on a relative basis among the 150 others who played the same course that day.
Furthermore, there are numerous in-depth golf analytics websites, such as GOLFstats.com or the official PGA Tour website, that have emerged to take advantage of the technological wave in golf and provide data accessibility. These websites provide fans and players access to vast amounts statistics on professional golfers and tournaments at an incredible level of granularity (i.e. their longest driving average or the number of fairway hits). Additionally, the Canadian site DataGolf.org has made available a live statistical model that displays the probabilities of every player’s winning changes for every PGA Tour and PGA European Tour as they happen. By mid-2018, their predictive model was outperforming most major betting companies. They present their data through outstanding data charts and other visualisations, including historical numbers dating back to 1990.
Other websites and mobile apps, such as ShotByShot.com, Arccos 360, Anova or Golfmetrics, have also started to leverage the use of advance analytics to improve amateur golfers’ game. Any player can now have access to the right tools that allow them to easily and accurately track different data points of their game, from driving, approach shots, sand shots to putting. These apps statistically break down a player’s game to help them identify the areas that most significantly improve their overall performance. They aim to accurately pinpoint a player’s strengths and weaknesses in driving, approach shots, short game and putting, and in more detailed subcategories using the strokes gained metric popularised by Mark Broadie. Through these apps, a player would enter their scores in the app, which in return will calculate their strokes gained values and compare them against golfers at various levels. The website or app will record and analyse the player’s data, determine the relative handicaps of their game and then identify the highest improvement priority and contributing factors to improve their game.
Data Analytics Agencies Are Supporting Golfers Make Sense Of Their Performance Data
Performance Analysis agencies and consultancies, such as Golf Data Lab or TeeBox Golf, have started to emerge in professional golf. These agencies often provide golfers with tailored technical support and produce objective analysis of their game to identify trends and assess strengths and weaknesses. Teams of analysts record a golfer’s round and provide them, or their caddy, a detailed breakdown of their performance with comparisons against previous rounds and other competitors. Some of the statistics collected and analysed by these agencies include:
Driving accuracy to fairway
Par 3, 4 and 5 accuracy analysis
Long, medium and short iron approaches
Short game analysis (<50 yards)
Putting analysis (including data such as conversion per distance, 3 putt frequencies, tap-in rates and missed putts analysis)
Clubs used and club efficiency
Shots type
Dropped shots analysis
Comparisons with PGA averages
Drive versus approach analysis
Strike quality examination
Directional tendencies
Consultancies like 15th Club, an unofficial stats partner for the 2016 European Ryder Cup team, have now established themselves as key influencers in the European game, from informing qualification process and captain’s picks to the partnerships and singles order. Through their valuable application of data intelligence, they have become another crucial voice in preparing every member of the European Tour and defining their training structures. They now work with over 40 professional golfers, who have seen an average increased in earning of $600,000 by simply improving their stroke by +0.15-0.25 per round. Similar to ShotLink in America, 15th Club uses GPS, lasers and cameras operated by a group of people to collect all the necessary data points to build their algorithms and models. Additionally, they offer a visualisation platform, Waggle, for players to access their performance data. Some of the statistics available in Waggle include strokes gained against the field, top three and bottom three strokes as well as other traditional stats.

New science-based and statistical data-driven golf training centres, such as Every Ball Counts, have been recently established to help elite pros and serious amateur golfers through demanding physical and mental training sessions. Aside from leveraging various of the technologies previously mentioned, Every Ball Counts also developed an algorithm with Harvard University that takes a player’s ShotLink data and looks at 900 data points calculates 19 different metrics to formulate a game plan on how to improve a golfer’s game.
New Metrics Are Leaving Traditional Statistics Behind
One of the most popularised metrics that has appeared from the analytics revolution in golf in recent years is strokes gained. The strokes gained metric was developed in 2011 by Mark Broadie, writer of the 2014 best seller Every Shot Counts, as an attempt to modernise more traditional golfing stats previously employed, such as driving distance or putts per round. One of the issues with traditional statistics that Broadie discovered was relating to the counting of the number of putts per round. This conventional metric did not take into account the distance of each putt. In other words, players who hit their approach shots closer to the hole may have fewer putts per green in regulation than a player who is a superior putter but doesn’t hit his approach shots as close. Instead, strokes gained adjusts for the initial distance of the putt and other relevant factors to illustrate a more accurate representation of the golfer’s skill level.
To calculate strokes gained, an analysis was performed on ShotLink’s database composed of 15 million shots from players across every PGA tournament to determine the value of each shot by benchmarking it to the average of historical shots with those similar characteristics. It is a model that predicts the probability of a golfer’s score for each hole on a shot-by-shot basis. Mark Broadie applied mathematical techniques of simulation to analyse different strategies using different clubs and targets off the tee. He simulated thousands of shots and played the hole thousands of times using different strategies to identify the most effective one. He also applied dynamic programming by optimising the sequence of play in a hole and coming up with the best strategy on the tee by working backwards off the green to determine what should be the target on the first shot.

Since its development, strokes gained has allowed golfers to better understand where they gain or lose ground. Mark Broadie started discovering aspects of the game that contradicted common beliefs. For example, he found that putting is only 15 percent of the shots difference between better players and average players, with the biggest difference actually being in ball striking, especially the number of penalised shots that those with high handicaps hit. In essence, long game is the separator between the best pros and average pros, since it explains about two-thirds of the scoring differences. Putting at 27 feet or 30 feet distance on the green does not matter as much as a shot in the bunker or the shot that lands on the green instead of the rough. The distribution of the importance of each type of shot that Broadie found suggested that approach shots accounted for 40% of the players’ scoring advantage, while driving was responsible for 28%, short game for 17% and putting covered the remaining 15%.
Data Analytics In Course Management
Aside from the direct benefits to a golfer’s play, courses all around the world have also made use of technology to improve their grounds. Data systems are allowing golf clubs to track every single shot played on their course in relation to handicap, age, gender, weather conditions, pace of play, tee usage and pin locations and provide them a detailed understanding of the interaction between players and the various features of their golf course. The aim is to efficiently improve golfer experience by increasing playability, course strategy or difficulty, environmental impact or pace of play, while reducing maintenance costs through reductions in redundant water, chemical and fertiliser usage, green, fairway, tee sizes and bunker volume and size in areas of little to no play. Companies like Golf Course Architecture are also providing golf-course operators with smartwatches that are worn by members to track every shot hit and its location, while golfers get all their statistics in real-time as they play.

How Are Pro Tour Golfers Applying Data To Their Play?
In recent years, a new generation of professional players have employed statisticians and data analysts to analyse the vast amounts data available and identify their strengths and weaknesses against those of their opponents in order to improve their performance and define winning strategies. One of these golfers is Rory McIlroy, who has made heavy use of the 32,000 data points per event that ShotLink System captures to benchmark himself against everyone else, particularly using statistics such as strokes gained.
In 2012, Dustin Johnson found immediate results when discovering through data analysis that he ranked 166 in wedge game. After identifying his specific area of weakness and fine-tuning his wedges using a high-tech Trackman device to monitor and improve the accuracy of his short game, he managed to improve his approach shots from 50-to-125 yards. By 2016, he had become fourth in the ranking.
Other golfers like Brandt Snedeker also embraced technology as early as 2011, when he became the first tour player to hire a full-time analyst. By 2015, using radar technology to track swing, he determined that his best swing launched the ball at 12 degrees with a spin rate of 2,400 revolutions per minute. He then used this information as a baseline when testing and acquiring new equipment that incorporated the latest advances in design and verify whether it improved his performance.
Other examples include Danny Willett, when in 2016 he made use of 15th Club to gain access to a team of golf professionals, data experts and software engineers who analysed ball locations at Augusta National and helped him plot his winning strategy during the 2016 Masters Tournament. The strategy consisted on taking advantage of Willet’s great wedge game between 75 to 100 yards on par 5s when his tee shots went wrong. He went on to win the tournament by making 11% of shots above par compared to the 26% field average.
Luke Donald, through his golf coach Pat Goss and the help of Mark Broadie, also rose through the ranks by taking advantage of analytics and the strokes gained formula to understand where to improve and inform the design of practices to improve specific statistics. These statistics showed Goss that even though Donald did not drive the ball far, he was very good at short game and putting. It allowed him to define a winning strategy where Luke Donald had to get almost a full shot in putting and the rest from the short game inside 100 yards and from iron play, and just break even with driving.

Today, data analysts in golf are becoming as important to tour pros as swing instructors and fitness trainers. They parse statistics to create better training plans and arm the golfers with game plans for each week. As data gets more complex and margins tighter, data analytics and the integration of technology in the sport will continue to rise and gain in importance. Golfers seem to have understood and accepted that and appear to be embracing the ever-growing technological revolution in sport.
Citations:
Chansanchai, A. (2018). PGA TOUR launches a new solution that gives golf fans more personalized content experiences. Microsoft News. Link to article.
Cloke, H. (2019). Data-driven design. Golf Course Architecture. Link to article.
Corcoran, M. (2019). Wise guys: Data Golf is taking analytics to a whole new level (pay attention, gamblers). Golf.com. Link to article.
Dusek, D. (2018). By the numbers: Analytics become an increasingly important part of golf. Golf Week Digital Edition. Link to article.
Greenberg, N. (2018). PGA Tour is embracing artificial intelligence, and it could change how you watch golf. The Washington Post. Link to article.
Kramer, S. (2018). This Is How Technology Meets Golf. Forbes. Link to article.
Lisota, K. (2016). How Dustin Johnson used data and analytics to become one of the best golfers in the world. Geekwire. Link to article.
Martin, S. (2015). Q&A with the godfather of golf analytics. PGA Tour Online. Link to article.
Morgan, T. (2016). Data analytics in golf: How a revolution in preparation is changing the sport. International Business Times, Sport, Golf. Link to article.
Ray, S. (2017). Don’t let the pencils fool you: Golfers are teeing up a tech revolution. Microsoft News. Link to article.
Schupak, A. (2017). Pro Golfers Find Winning Rounds From Numbers Crunching. The New York Times. Link to article.
Tour Insider. (2019). The World Of Golf Analytics. Tour Insider Today’s Golf. Link to article.
Wacker, B. (2019). Why a little stat analysis goes a long way on the PGA Tour. Golf Digest, Golf World. Link to article.
Wooden, A. (2019). The Secret To The Perfect Golf Swing Is Hidden In The Numbers. Intel Technology Cloud Analytics Hub. Link to article.
Woodie, A. (2017). Optimize Your Golf Game with Advanced Analytics. Datanami. Link to article.
Wong, W. (2015). Golf Gets into the Swing of Analytics. BizTech Business Intelligence. Link to article.