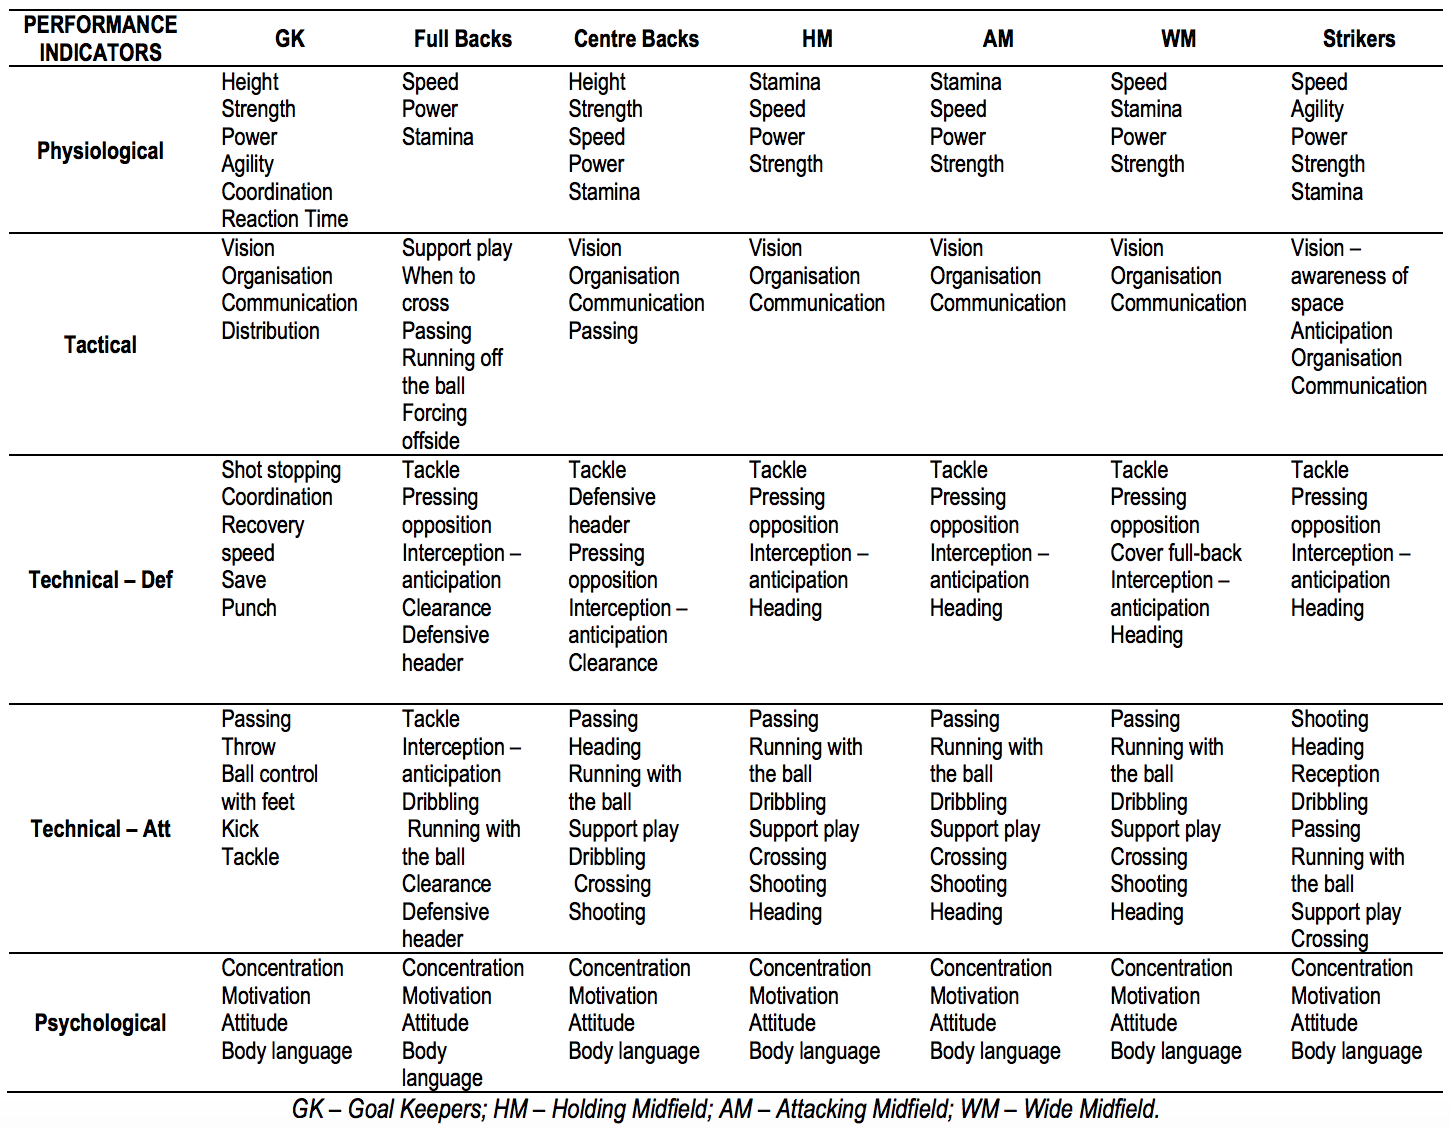
Micheal Hughes et al discussed in 2012 in their article "Moneyball and soccer - an analysis of the key performance indicators of elite male soccer players by position", how team sports like football offer an ideal scope for analysis thanks to the numerous factors and combinations, from individual to teams, that can be used to identify performance influencers.
READ HUGHES M.D. ET AL'S FULL ARTICLE HERE
The article suggests that, in a sport like football, in order for a team to be successful, each player must effectively undertake a specific role and a set of functions based on the position the play in on the field. Through a study carried out with 12 experts and 51 sport science students, they aimed to identify which are the most common performance indicators that should be evaluated in a player's performance based on their playing profile. They started by defining the following playing positions in football:
Goalkeeper
Full Back
Centre Back
Holding Midfilder
Attacking Midfilder
Wide Midfielder
Strikers
Each performance indicator identified by position would be then categorized into the following 5 categories:
Physiological
Tactical
Technical - Defensive
Technical - Attacking
Psychological
Through group discussions between the experts and the level 3 sport scientist, they came up with the following traits required for each of the above positions.
Source: Moneyball and soccer by Michael Hughes et al (2012)
The study identified that most performance indicators of outfield players were the same across position, with only the order of priority of each PI varying by position. Only goalkeepers had a different set of PIs than any other position. While these classifications of skills by position were done in a subjective method (ie. group discussion), it is a good first step towards the creation of techno-tactical profiles based on the players position and functions on the field, as pointed out by Dufour in 1993 in his book 'Computer-assisted scouting in soccer'. The above table provides a framework in which coaches and analyst can further evaluate the performance of players in relation to their position. However, tactics and coaching styles or preferences may cause the order of priority of each PI within each category to vary by team. The article also suggests that a qualitative way of measuring the level of each performance indicator should be used to evaluate a particular player.
The above suggests that positions may play a key role when assessing performance in footbal. From a quantitative perspective, when analysing the performance indicators to determine success or failure, or even to establish a benchmark to which to aim for, there are several metrics an analyst will look to gather through notational analysis:
Technical:
Shooting game
Total number of goals
Total number of shots
Total number of shots on target
Total shot to goal scoring rate (%)
Total shot on target to goal scoring rate (%)
Shots to goal ratio
Shots on target to goal ratio
Total number of shots by shooting position (ie. inside the box)
Total number of shots by shot type (ie. header, set piece, right foot, etc.)
xG (read more)
Passing game
Total number of passes
Total pass completion rate (%)
Total number of short passes (under X metres away)
Total short pass completion rate (%)
Total number of long passes (over X metres away)
Total long pass completion rate (%)
Total number of passes above the ground
Total chip/cross pass completion rate (%)
Total number of passes into a particular zone (ie. 6 yard box)
Total zone pass completion rate (%)
Pass to Goal ratio
Total number of unsuccessful passes leading to turnovers (ie. interceptions)
Total pass turnover rate (%)
Defensive game
Total number tackles
Total number of tackles won
Total tackle success rate (%)
Total number of tackles in the defensive third zone
Total number of tackles won in the defensive third zone
Total number of fouls conceded
Total number of fouls conceded leading to goals conceded (after X minutes of play without possession)
Total number of pass interceptions won
Total number of possession turnovers won
Tactical:
Attacking
Total number of set pieces
Total number of attacking corners
Total number of free-kicks (on the attacking third zone)
Total number of counterattacks (ie. based on X number of passes between possession start in own half to shot)
Average duration of attacking play (from possession start to shot)
Average number of passes per goal
Possession
Total percentage of match possession (%)
Total percentage of match possession in opposition's half
Total percentage of match possession in own half
Total number of possessions
Total number of non-shooting turnovers
Ratio of possessions to goals
Total number of passes per possession
Total number of long passes per possession
Total number of short passes per possession
Defensive
Total number of clearances
Total number of offsides by opponent team
Total number of corners conceded
Total number of shots conceded
Total number of opposition's passes in defensive third zone
Total number of opposition's possessions entering the defensive third zone
Average duration of opposition's possession
It is important to note that teams may adapt both their tactics and style of play based of the various circumstances they face in a game. For example, a team scoring a winning goal in the last 10 minutes may chose to give up possession in order to sit back in their defensive third during the remaining of the game. When using quantitative analysis to determine the success or failure again the performance indicator, it is important to take context into consideration for a more complete and accurate analysis.

