Dr Manuel Stein has spent over 7 years researching and analysing player movement using detailed positional football data. His work has focused on the investigation of real-time skeleton extraction to perform match analysis of player movement with the aim of fostering the understanding of comparative and competitive behaviours in football. He has revolutionised the way match and tactical analysis is performed by teaching computers how to measure key playing aspects of the sport, such as team dominance or a player’s control of space derived directly from video footage. Stein has developed an automatic and dynamic model that takes into account the contextual factors that influence the movement and behaviour of players during a match. This novel player detection system automatically is able to display complex and advanced 5-D visualisations that are superimposed on original video footage.
Generating Data From Match Video Footage
The first step for any meaningful quantitative analysis is to obtain highly detailed data to properly test our assumptions. However, gathering highly detailed sport data may be challenging to obtain unless sophisticated tracking technology is used and the results of such tracking are easily accessible to the analyst. On top of that, when it comes to positional player data in football (i.e. xy coordinates of players on the pitch), gaining access to this level of granular data is especially challenging for most analysts. This is the same problem Stein faced during the initial phases of his research and that led him to develop a method for data extraction on his own using television footage and computer vision techniques.
Identifying Players On The Pitch
Stein’s method of extracting data from television footage started with the detection of each player on the pitch. In order to automatically identify the players, Stein addressed the unique colours that are present on the football pitch, more specifically the colours of the players’ shirts. By picking a player in the video, he constructed a colour histogram that best described the most prominent colours in that player’s shirt. Once those colours were identified, he then automatically searched across the video frame for contours of a minimum size that contained those same colours detected from that player’s shirt to spot all other players with the same colour shirt. The computer then automatically calculated the centroid of each detected area (i.e. the players as well as minor noise) and used the average measurements of human proportions to draw boxes enclosing the entire player on the screen.
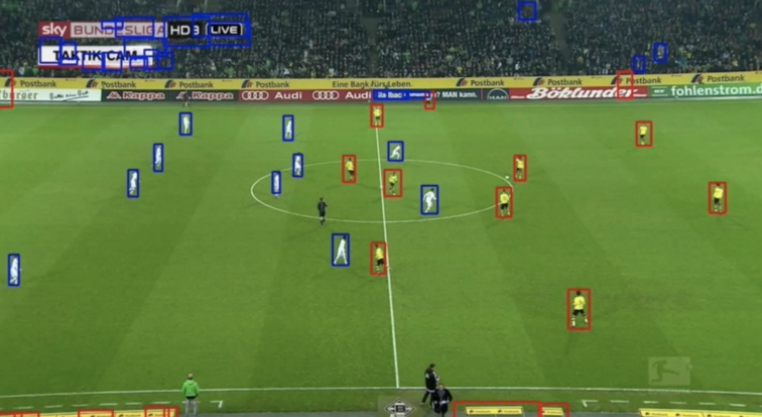
Colour-based player detection (Source: Manuel Stein at FC Barcelona Sports Tomorrow)
This colour-based player detection method enabled Stein to identify all players on the pitch. The additional noise captured on the sidelines and stadium crowd was later removed by using threshold and ignoring areas that only appear on screen for a brief moment of time. However, this colour-based detection approach has certain limitations depending on the match footage. Lighting variations during matches that kick off under sunlight and finish around dusk do not impact colour perception in humans, but they do so for automatic colour-based player detection systems, as towards the end of the match computers will not be detecting the same colours as they did during kick off.
In order to solve this limitation and develop a system that works on all match conditions, Stein explored additional automated real-time methods to simultaneously extract player body poses and movement data directly from the video footage. One of those methods was the use of OpenPose, a well-known and established computer vision system for human body pose detection. However, OpenPose was not a suitable option when working with football footage, as the system struggles to detect small scaled people on the screen and is also unable to be computed in real-time during a match. Instead, Stein developed and trained his own deep learning model completely from scratch.

Body pose detection system (Source: Manuel Stein at FC Barcelona Sports Tomorrow)
Stein’s human body detection model uses a skeleton model based on a hierarchical graph structure that represents a body’s pose. Every node on the hierarchical graph corresponds to the position of a body part from the person’s skeleton such as joints, ears, eyes and so on, called key points. The edges of this hierarchical graph represent an anatomical correct connection between two body parts. Stein’s body pose detection process followed two stages: the detection of individual body parts followed by the probabilistic reconstruction of the skeletons by connecting all identified body parts together. The constructed skeletons of the players were then overlayed on the original video footage for easy visualisation. Stein model’s estimation accuracy results outperformed those of OpenPose when estimating the skeletons on medium-scale people from the Microsoft COCO dataset. Moreover, their model architecture is also optimised for real-time and low latency video analysis, unlike OpenPose which struggles to run on resolutions of close to 4k.
Identifying The Ball
The next step was to detect the ball. For that, the model followed a two-step approach: a per-frame candidate detection step followed by a temporal integration phase. It first detected all possible objects on the screen that could potentially be the ball by using a convolutional neural network. The computer detected things such as the penalty spot, the corner kick spot, the centre spot, white football boots or the ball itself as being possible candidates. The next step was to identify an accurate and realistic ball trajectory over a period of time from the previously identified candidates using a recurrent neural network. This enabled the model to specify which one out of the previously detected objects was indeed the ball, as it was moving throughout the footage as a ball would be expected to move. By using this approach, the ball could be tracked even when it was not visible on the video footage. For instance, the computer continued to track the ball even when a player picked it up before a penalty kick and happened to hide it from the camera.
Determining Player And Ball Location On The Pitch
Once both players and the ball have been detected, the following step is to determine their location on the full football pitch. The challenging part in this section is the fact that the camera is continuously focusing on different parts of the pitch rather than the pitch as a whole. To solve this issue, Stein had to produce a static camera shot by creating a panoramic view of the complete stadium using a subset of input frames from the video footage (i.e. all frames from the first two minutes of a match). The overlap of all these snapshots from the video footage was then used to recreate a panoramic view of the pitch that allowed Stein to calculate the pitch’s homography. He was then able to identify how two different images connected together, or detect whether one image was simply a subset of a larger image. The homography calculation then enabled Stein to project each of the frames from the video footage into the panoramic view of the pitch as a unique reference frame and fully visualise where on the full pitch each frame took place.

Projection of frames on the panoramic view of the full pitch (Source: Manuel Stein at FC Barcelona Sports Tomorrow)
With all players and the ball correctly identified and their position accurately projected on a panoramic view, the next step was to project these player locations into a normalised football pitch to start generating usable positional data for further analysis. By providing the system with a standard image of a football pitch, a user can select a minimum of four points both from the panoramic view and their image of the pitch in order for the system to use the homography calculations from the panoramic view and translate them into the standard image of the pitch. This allows the system to automatically plot accurate player positional data on a standard diagram of a football pitch.
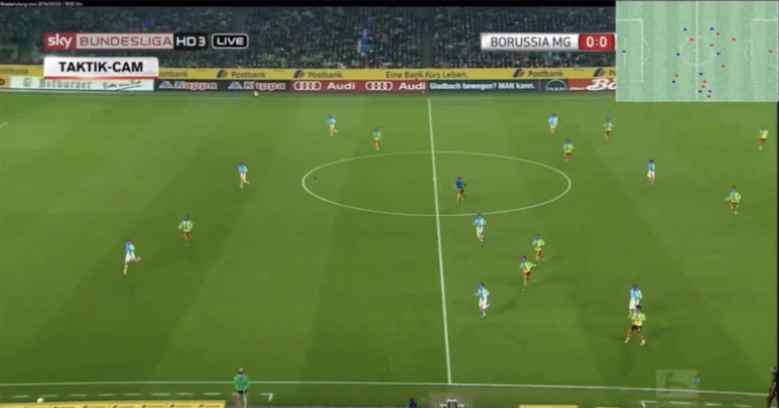
Player locations and movements illustrated in real-time on a diagram of the pitch on the top right corner (Source: Manuel Stein at FC Barcelona Sports Tomorrow)
Automatically Measuring Contextual Information From Video
Stein took his research further by incorporating the tracking of elements in a match that are not clearly visible to a computer, areas such as the dependencies, influences and interactions between players during the various scenarios of a game. For a fully automated football analysis system to work, this context information that is obvious to humans also needs to be taken into account and measured by the computer. In a dynamic team sport like football, players are more than simple and independently moving dots on a pitch. There is a complex network of interactions and dependencies that dictate how a player reacts to a situation, how they cooperate with teammates and how they attempt to prevent the opposing players’ actions.
Interaction Spaces
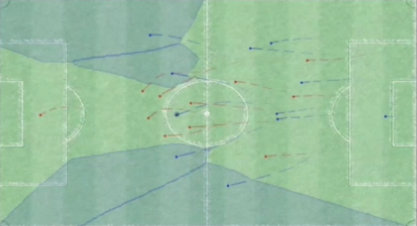
One way to automatically measure contextual information from player positional data was to identify the specific regions on the pitch that are controlled by the different players. Stein argued that each player has a surrounding area around them that he fully controls based on his position on the pitch. These control regions are what he called ‘interaction spaces’ on the pitch that a player can reach before any opposing player or the ball could reach that same space. The size and shape of these interaction spaces are influenced by player speeds and directions, as well as the distance between the players and the ball. This is because players further away from the ball may have more time to react.

Interaction spaces for each player (Source: Manuel Stein at FC Barcelona Sports Tomorrow)
On top of that, competition between two opposing players to control a certain zone has also an impact on the shape of these interaction spaces, as players from the opposing team will aim to restrict certain opposing player movements. Therefore, when defining interaction spaces on the football pitch, Stein aimed to consider these interdependencies that may restrict a player from reaching a particular zone before an opposing player to maintain ball possession. This can be seen in the above illustration between the blue team’s defensive line and the red team’s forwards, where players that are close to opposing players may restrict each other’s interaction spaces. Lastly, Stein was able to leverage the pitch visualisations of the previously recorded positional data and enrich it with additional context information that clearly illustrates each interaction space in real-time.
Free Spaces
An alternative way of contextualising automatic tracking data was the inclusion of free spaces. Stein calculated free spaces by segmenting the pitch into grid cells of 1 squared metre. He then assigned each respective cell to the player with the highest probability of reaching that cell in relation to the distance to the cell, their speed and direction of movement. Similarly to interaction spaces, free spaces where the cells from the grid that a player could reach before any other opposing player. Ultimately, free spaces represented the pitch regions a specific team or player owned.

All free spaces identified for a team in blue (Source: Manuel Stein at FC Barcelona Sports Tomorrow)
To evaluate which free zones were more meaningful for analysing, Stein ranked all free spaces on the pitch by their value in relation to their respective sizes, number of opposing players overlapping such spaces and the distance to the opposing goal.
All high value free spaces shortlisted for a team in blue (Source: Manuel Stein at FC Barcelona Sports Tomorrow)
Dominant Regions
Stein expanded his concepts of region control on a football pitch by using similar calculations to those of interaction spaces to create a model that highlights the dominant regions for each team. These dominant regions are calculated by looking at areas on the pitch that can be reached by at least 3 players of the same team simultaneously. Ultimately, they represent the areas in which a particular team has substantially more control over the other.

Dominant zones by players in the blue team (Source: Manuel Stein at FC Barcelona Sports Tomorrow)
Cover Shadows
Similarly, Stein extended the concept of interaction spaces to calculate player cover shadows, referring to the area a player can cover in relation to the position of the ball. In other words, a player has full control to prevent a ball from reaching their cover shadow region. Cover shadows can be thought of as a hypothetical light source coming from the ball at a 360 degree angle. These cover shadows represent the regions that the player is able to control before the ball gets to them.

Cover shadows illustrating a player’s area coverage in relation to the ball (Source: Manuel Stein at FC Barcelona Sports Tomorrow)
Applications Of This Automated Player Tracking System
When looking at the possible applications of his automated tracking system, Stein had to consider the roles of Performance Analysts and the coaches. For a Performance Analyst, video and movement data are key when analysing the strengths and weaknesses of their team and the opposition. On one side, analysts have a window on their screens with their video analysis software opened, such as SportsCode or Dartfish, to notate events and analyse playing actions. While on the other side, they have another window with the original video footage of the match that they use to verify and interpret any observations captured from their coding. Often what this means is that the analyst is looking at two different windows and comparing them to one another. While this is common practice in the field of Performance Analysis, the exercise of switching focus between two screens may often prove to be an inefficient approach to video analysis. Focusing on two windows simultaneously can prove significantly challenging to the human eye, often leading to a ‘pause and play’ exercise during analysis.
Stein aimed to solve this problem by combining the benefits of the visualisation of the pitch from his new automatic player tracking system with the original match footage. By simply inverting the homography from the abstract pitch into the video footage, he was able to draw visualisations directly on the real pitch. This allowed him to illustrate in real-time different types of analysis, from evaluating offensive free spaces to looking at players’ interaction spaces.
Interaction spaces automatically displayed directly on real match footage (Source: Manuel Stein at FC Barcelona Sports Tomorrow)
Stein’s dynamic and automatic real-time visualisation offered a whole new range of design opportunities for match analysis in football. For instance, the system was able to change a player’s shirt colour based on their behaviour (i.e. based on fatigue). It was also able to illustrate the best passing options available to the player with the ball.
Automatically computed best passing options (Source: Manuel Stein at FC Barcelona Sports Tomorrow)
This novel tracking method provides an invaluable automatic measurement of the context of a match situation. However, similar to any other analytical tools, it needs to be correctly applied in order to make a difference to team and player performance. Aside from the clear operational efficiencies brought by the automation of tedious notational work, the benefits in knowledge acquired from this system needs to be appropriately incorporated into the analysis loop. For instance, data on free spaces can be used to automatically detect suboptimal movements from players and suggest potential improvements for such behaviours. For example, an analysts can select specific situations where there was a shot on goal or dangerous play by the opposition to then identify which of their own players had control over free spaces that could have prevented such occasion. Once a selection of possible players have been identified, analysts can assess which one of those players lost control of their space the fastest and how such player could have kept control over his opponent. The identified player can then receive information about which should have been his optimal position on the pitch and their control of field space in order to reduce the free spaces towards his own goal left to be exploited by their opponents. Stein’s system is able to provide this guidance to analysts, coaches and players by automatically calculating the player’s moving trajectory based on his speed and interactions space and suggest an optimal realistic movement for that player, from the starting position to the optimal point. This means that the system can automatically suggest improvements in collective behaviour based entirely on the contextual information being processed.

Click and drag interactivity (Source: Manuel Stein at FC Barcelona Sports Tomorrow)
The system also offers interactivity, where analysts and coaches can drag and drop players around the pitch to explore the different control spaces the player would benefit from if they were in a different location of the pitch. By moving a player to a different location, the system automatically updates the player’s trajectory and interaction spaces relating to their new location and the other players around him. This gives coaches and analyst the possibility to interact with the analysis and to adapt the system based on their own acquired knowledge of the sport.
Automated systems such as the one developed by Manuel Stein are bringing exciting levels of innovation to the sport by directly integrating data and video together. Thanks to these systems, football experts, coaches and analysts become more aware of the power of analytics once they are shown the context of real world scenarios, which in turn leads to better analytical approaches being developed that are better incorporated into the daily realities of the roles of analysts and coaches. Ultimately, it reduces or completely removes numerous tedious and time consuming work performed by analysts today in a revolutionary way that frees up time away from simple data collection which can in turn be placed in more dedicated and advanced analysis of the sport.
Further Reading:
Stein, M., Janetzko, H., Breitkreutz, T., Seebacher, D., Schreck, T., Grossniklaus, M., Couzin, I. & Keim, D. A. (2016). Director's cut: Analysis and annotation of soccer matches. IEEE computer graphics and applications, 36(5), 50-60. Link to article