
Michael Lopez, the Director of Data and Analytics at the NFL, recently discussed at the FC Barcelona Sports Tomorrow conference the way that his Football Operations team and the wider NFL analytics teams leverage a large community of NFL data enthusiasts to obtain a better understanding of the game of American Football. In his talk, Michael walked through the journey that the NFL took to develop expected rushing yards, a concept that began as an initial idea within their Football Operations group and ended up making its way up to the NFL’s Next Gen Stats Group and the media.
What To Analyse With The Data Available In The NFL?
The first step that the NFL Football Operations team took to figure out what should be answered with the use of data is to try to understand what the general public thinks about when they watch an NFL game. To figure this out, they looked at a single example of a running play in a 2017 season game between Dallas and Kansas where the running back, Ezekiel ‘Zeke’ Elliot took 11 yards from a 3rd down and 1 yard-to-go. This run by Zeke Elliot eventually allowed Dallas to successfully move further down the field and score points.
Statisticians at the NFL then tried to understand what can be learned from a play like this one by breaking down the play to obtain as many insights on the teams involved, the offence, the defence, and even the ball carrier. An initial eye test by simply looking at the video footage told the analysts that in this particular play Zeke Elliot - the ball carrier - had a significant amount of space in front of him to pick up those 11 yards. But how could data be applied to this play to tell a similar story? To do so, NFL analysts first needed to take a look at the data and information that was being collected from that play, to understand what was available to them and the structure of the datasets that will allow them to come up with possible uses for that data.
There are three types of data being collected and used by the NFL analytics teams: play level data, event level data and tracking level data. Each one of these types of data present different levels of complexity, with some having been around for longer than others.
Play Data:
This data contains the largest amounts of historical records and includes variables like the down, distance, yard line, time on the clock, participating teams, number of time outs and more. It also includes some outcome variables like number of yards gained, passer rating to evaluate QBs, win probability and expected points.
Event Data:
This data is generated from notating video footage. It is usually performed by organisations such as Pro Football Focus or Sports Info Solutions by leveraging their football expertise. These companies tag events using video analysis software and collect data points such as the offensive formation, number of defenders in the box, defenders closer to the line of scrimmage, whether a cover scheme was man versus zone, the run play called and so on.
Tracking Data:
This type of data refers to 2-D player location data that provides the xy coordinates as well as the speed and direction of players. It is usually captured at 10fps using radio frequency identification (RFID) chips located on each player’s shoulder pads as well as the ball. It tracks every player during every play of every game. This is the most novel type of data being collected by the NFL. Player tracking data was only started to be shared with teams from the 2016 season onwards.

2D Player Tracking Data (Source: Mike Lopez at FC Barcelona Sports Tomorrow)
The sample sizes of data that is available for NFL analysts to come up with new metrics varies for each one of these data types. When it comes to play data, there is an average of 155 plays per game, and 256 games played in a single season. This means that for the longest time in the sport, analysts have had a maximum of almost 40,000 plays per season to figure out the answers to NFL analytics questions. A similar scenario is true with event data, where the dataset available to NFL analysts will be a multiple of the number of observations you are producing through the notation of events from a maximum of 40,000 plays per season.
A very different scenario occurs with player tracking data, where the sample size is substantially larger. With 2-D player location of each player being tracked at 10fps on plays that usually last 7 seconds, the data collected jumped from those 155 observations (plays) per game in play-level data to between 200,000 and 300,000 observations for a single game for tracking-level data. This brought a more complex dataset to the sport and opened the door to new questions and metrics to be explored by NFL analysts.

Applying The Available Data To The Analysis Of The Game
There are various approaches that the NFL analyst could have taken to evaluate the running play by Dallas where Zeke Elliot gained 11 yards. Ultimately, they wanted to figure out what was the likelihood of Zeke Elliot picking up those 11 yards in that running play.
One of these approaches was to assign a value to the play to evaluate how the running back performed by using metrics like yards taken, win probability or expected points. By using this play level data, analysts would be merely calculating the probability of those 11 yards being achieved using simple descriptive metrics, such as the fact that it was a 3rd down and 1 yard-to-go in a certain location of the field during the first minutes of a scoreless match. If they then compared Zeke Elliot’s outcomes based on similar plays, all of these metrics would have shown positive values, as gaining yards would have had an increase in both the team’s win probability and expected points. Zeke Elliot’s 11 yard run may have well been above average when you describe plays using play level data. However, this approach would be missing the amount of credit that the running back, the offensive line and the offensive team should really receive from this outcome given the specific situation they faced.
Another approach was to leverage event level data to provide additional context of the play. This type of data could have helped understand Zeke Elliot’s performance by providing additional variables, such as the number of defenders in the box or the play options available, which would have allowed to compare the probability of taking 11 yards against other plays with similar characteristics. However, these approach may have also shown positive results due to the relative large yardage gain Zeke Elliot achieved for the run. Moreover, appropriately describing the situation only using event data may be challenging or inaccurate as it is conditioned to the video analyst’s level of football expertise and ability to define the different key elements of the play.

Instead, NFL analysts decided to make use of the 2D player tracking data for that play to come up with the spatial mapping on the field. By having a spatial mapping of the field, analysts could visualise the direction and speed in which each player was moving during the duration of the run, as well as what percentage of space on the field was owned by different players of each team. This gave analysts an idea of the areas that were owned by the offence and the ones owned by the defence, providing them with better understanding of the amount of space in front of the running back, Zeke Elliot, to take on extra yardage. The information obtained from the spatial mapping could then be used to calculate yardage probabilities given the extra condition of space to more accurately assess how well the offensive team performed.

Spatial Mapping of Zeke Elliot’s Run (Source: Mike Lopez at FC Barcelona Sports Tomorrow)
In this diagram above, it is clear that the offense owned most of the space in front of Zeke Elliot, not only 11 yards ahead but even 15 yards in front of the running back, with defenders nowhere close to him. As oppose to evaluating the play with play or event level data, using tracking data raised further questions on the performance of Zeke Elliot on that play, as it may not be as positive as the other approaches may have suggested given the amount of space he had in front of him.
Following this example, NFL analysts next tried to answer the question of how to leverage player tracking data more widely to better understand what happens during plays. The NFL Football Operations analysis team wanted to learn more about how this data could be used to compare the performance of players given the positioning, direction and speed of all 23 players on the field. More specifically, it involved understanding the probability distribution of all possible yardage increments - i.e. the running back taking or losing 5, 10, 15, 20 yards and so on – to obtain a range of outcomes with their likelihoods that would then allow analysts to compare different performances in different plays. A probability distribution that is based on yardage increments could then be explored further to provide analysts additional insights on first down probability, touchdown probability or even probability of losing yardage on a given play in spatial mapping terms. Ultimately, this probability distribution could be turned into an expected yards metrics for running backs by multiplying each yard by the probability of reaching that yardage and summing up all the values together.
Leveraging AWS And The Wider NFL Community
The main goal of the NFL Football Operations team was to better understand player and team performance by leveraging the new xy spatial data from player tracking to come up with new metrics, such as expected yards, touchdown probability or run play. The NFL Football Operations team worked closely with the NFL’s Next Gen Stats Group to understand the value that such metric will provide to the sport and define a roadmap of how to go about developing such metrics. Sunday Night Football and other media broadcasters also showed a strong interest in using this new metrics to better evaluate performances on air.
In their first attempt at producing new metrics from player tracking data, NFL analysts partnered with data scientists from Amazon Web Services (AWS) to figure out how this large dataset of player tracking data could be used to come up with new football metrics. Unfortunately, after trying a wide set of tools, ranging from traditional statistical methods to gradient boosting and other machine learning techniques, the NFL Football Operations and AWS partnership never produced results that were satisfactory enough to be used by NFL Next Gen Stats Group or the media. While they learned about possible application of the spatial ownership distribution on the field, when it came down to validating the results against the one example of Zeke Elliot’s 11 yard running play, the results did not provide enough confidence to be used for the wider analysis of the sport. The AWS-NFL data science collaboration had reached a dead-end in their analysis.
Source: NFL Next Gen Stats
In order to unblock this situation and produce a metric from tracking data that would match what was seen in the video footage, the NFL Football Operations team leveraged the crowd sourcing wisdom in football statistics through the Big Data Bowl, an event they organise since 2019 and that was also sponsored by AWS. The Big Data Bowl is an annual event that serves as a pipeline for NFL club hiring, as it helps identify qualified talent that can support the NFL’s Next Gen Stats domain in analysing player tracking data. Since player tracking data has not been around for a long time, this event enabled the NFL to understand what the right questions to ask from this data are and how to go about answering them. The Big Data Bowl also serves core NFL data analytics enthusiasts who want extra information on the sport by helping them understand more about the NFL through more intuitive metrics that more clearly reflect how fans think about the game. For the past couple of years, this event has also proven to be a great opportunity for NFL innovation, as it has successfully tapped into the global data science talent to solve problems that a team of data scientists at AWS and the NFL could not resolve on their own. The first Big Data Bowl in 2019 saw 1,800 people sign up to take part, with 100 final submissions from having completed the task given. Out of these pool of analysts and data scientists, 11 went on to be hired by NFL teams and vendors. The winner of the 2019 competition is now an analyst for the Cleveland Browns.

Source: NFL Football Operations
The success of the Big Data Bowl 2019 edition meant that the NFL Football Operations would decide to take advantage of the Big Data Bowl 2020 event to develop their highly anticipated expected yards metric from the 2D player tracking data. Instead of trying to figure out the metric internally on their own, they took a ‘the more the merrier’ approach to exploit the opportunities available from the analytics talent across the world. The NFL Football Operations team shared the exact player tracking data with the participants in the event, who were given the task of predicting where the running back would be after a handoff play, such as the one earlier discussed between Dallas and Kansas. By receiving this player tracking data, participants now had valuable data points specifying the positions of all the players on the field, their speed, the number of players in front of the running back, who those players were, and more. All they needed to do is to come up with a method that would allow the NFL to understand whether Zeke Elliot’s performance was above or below average.
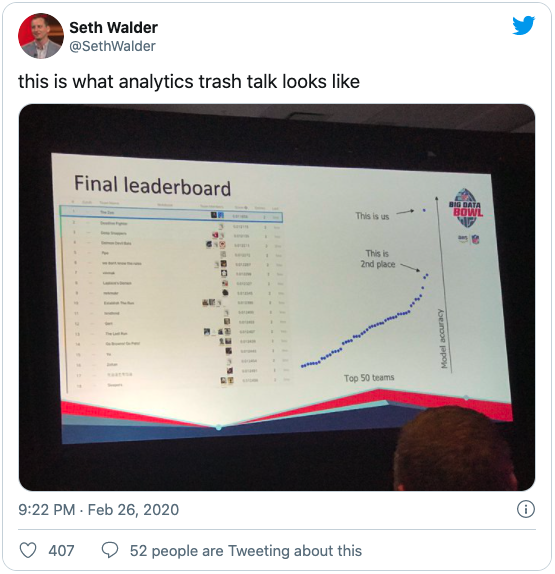
The competition launched in October 2019, when data was shared and released by the NFL. There were a total of 2,190 submissions for the event, with participants from over 32 countries. The launch was followed by a 3-month model building phase to allow teams to develop their algorithms. These algorithms were later evaluated in real time during the 5-week model evaluation phase of the competition. This model evaluation phase tested each algorithm’s predictions using out-of-sample data and compared the results with the true outcomes. The competition used Kaggle as their main data science platform to encourage interactions and communication across teams through forums. It also provided a live leaderboard where teams could see how well their algorithms were performing against other teams. Team scores were completely automated based on how accurate the algorithms were against real data. The winning team was a team called ‘The Zoo’, formed by two Austrian data scientists, who came up with a 5 dimensional convolutional neural network containing only five inputs: the location of the defenders, the routed distance between defenders and the ball carrier, the routed speed of the defenders and ball carrier, the routed distance between all offensive players and all defensive players, and the routed speed of all offensive players and all defensive players. They eventually presented their model in the NFL Scouting Combine event that was attended by more than 225 teams and club officials. They also received a cash prize of $75,000.

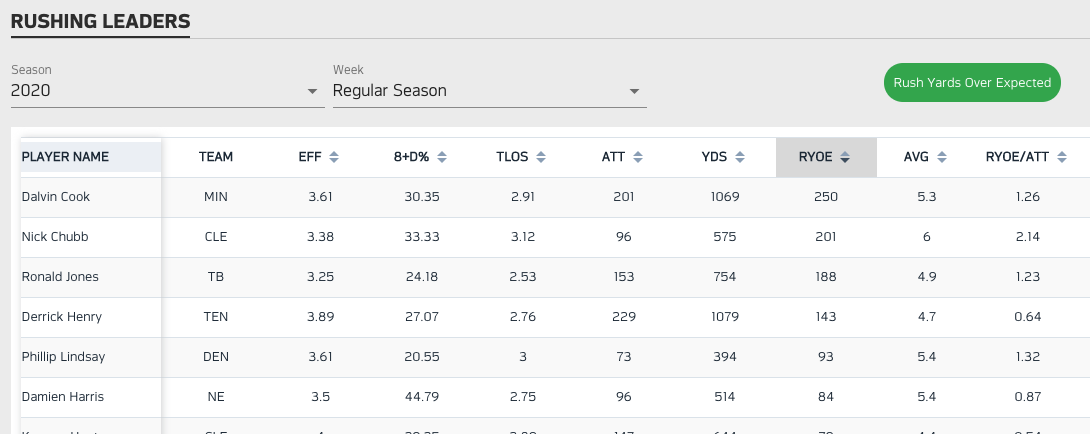
The winning team’s model results significantly outperformed those of the rest of participants. The calibration of their model showed an almost perfectly calibrated model where their predicted number of yards closely matched the observed number of yards from an out of sample dataset. Their model was able to take data from a carry and predict the yardage that carry would achieve, not only for small gains of 3 to 5 yards but also for longer yard gains of 15 to 20 yards, which are rarer in the sport. Thanks to their model, an expected yards metric could be produced for every running play. This now provides a valuable tools to assess performance of running plays such as the one by Zeke Elliot. For example, when a player takes 29 yards from a run, if the model calculated an expected yardage gain of 25 yards for that run given the spacing the running back had at the handoff, that player should only get credited for having achieved 4 yards above the average. This new way for interpreting a 29 yards run would not have been possible unless a model successfully conditioned its probability calculation based on the space available to the running back to determine whether that player has performed above or below expectation.

Winning team’s calibration plot (Source: NFL Football Operations)
The benefits of the Big Data Bowl format was that unlike hackathons, where participants may only get one or two weekends to produce something of value, this type of event enabled enough time for the teams to navigate the complex player tracking data set and come up with actionable insights. The NFL was then able to immediately obtain and share the new derive metrics with the media and their Next Gen Stats group to be used for their football analytics initiatives. Thanks to this approach, clubs can now better evaluate their running backs. Moreover, other industries, such as the growing betting industry in the USA may also benefit from the development of expected yards for their betting algorithms. Lastly, expected yards are now being widely used by NFL broadcaster to show whether running backs are performing well or not during the duration of a game. Metrics like this one would not have been possible without the NFL tapping to a global talent pool of data scientist to help them come up with this novel expected yards metric.
The NFL is continuing to run their Big Data Bowl this year, with their 2021 edition being a lot more open ended than previous editions. This time the task focuses on defensive play. They are sharing pass plays from the 2018 season and are asking participants to come up with a model that defines who are the best players in man coverage, zone coverage, how can the model identify whether the defence is man or zone, how to predict whether a defender will get a penalty and what types of skills are required to be a good defensive player. It leaves the interpretation and approach to the participants to define and allows them apply the right conditioning to the data provided. This approach of opening your data to the public in order to push data innovation forward has proven successful and would be interesting to see if other sports will adopt similar initiatives.