Interview with Matthew Egan, First Team Analyst at Bath Rugby

Matt Egan is a First Team Performance Analyst at Bath Rugby focusing on Attack and Backs. He previously worked for the England RFU and Leicester Tigers. Matt tells us about his experiences and what it is like to be an analyst at Bath Rugby.

Sports Performance Analysis - Matt Egan.jpeg

Tell us about your background. What made you want to become a Performance Analyst?

I am from Northamptonshire, a small town called Corby. I went to Loughborough University and ended up doing a Sport Science degree there. When I was at Loughborough, the university had a mentorship programme at Leicester Tigers, so for my Performance Analysis module I would go work at Leicester Tigers with Simon Barbour, who was my first boss. He was unbelievable, one of the top in Performance Analysis in Rugby Union.

I was working a Leicester Tigers throughout my final year of university. Obviously, I would learn the theory at uni and then go do the hands-on experience at Leicester. The way Leicester works is that, when you are an intern, you can also go and work for Nottingham as well. I would work at Leicester Tigers under Simon and some other analysts, and then also when there was a game at Nottingham I would do that by myself. It was really good learning.

After university, I decided to go travelling. I went to New Zealand to play rugby out there for the season. I loved it. Then, while I was in New Zealand, Simon contacted me about a job that came up with England. It was through Insight Analysis, formerly PGIR when I first joined. The job came up with PGIR, did the interview on Zoom from New Zealand and then got the job. I had to come back to England in two weeks time, which meant my travelling was cut short, but it was too good of an opportunity to refuse. There are not that many times an opportunity like that comes up, especially in a professional environment.

At England I was working directly with Mike Hughes and Duncan Locke, the two England Senior Analysts at the time. They were my bosses and I worked directly with them. I also worked with Kate Burke, who is also in the RFU, and Austin Fuller, who is now at Hudl. They were the senior characters in the environment at PGIR at the time. I started doing all the individual coding for the English Premiership squads each week. I also filmed and coded the Championship. I did the Bedford Blues and loved it there. The coaches there are unbelievable, really good guys.

After working on that for a while and as I progressed, Mike and Locke kept introducing me more and more into the senior work. After a couple of months, I was there in camp doing all the Six Nations, Autumns and Summers. I became heavily involved. I was also in the 2015 World Cup, which started off as a highlight but did not end as a highlight (England did not reach the knockout stage). After that World Cup, Eddie came in and there was some change in personnel. Locke left so I then stepped up and went to the Australia 2016 tour with Mike. It was an unbelievable experience.

As I was in Australia, the Bath Rugby job came up. Speaking to Mike, it was very much that he was not going to be leaving England anytime soon, so for me to get more experience the idea was to go elsewhere and work at a club for however many years and then potentially return back to England. I joined Bath Rugby and worked with Dan Cooper, the Head of Performance Analysis at Bath Rugby and who had previously done the England 7s and the Olympics. I also work with Matt Watkins who has been there at Bath pretty much all his career. The two are very good analysts. Both have different traits and are very good people to work with.

What does a typical day as a Performance Analyst at Bath Rugby look like?

As a First Team Analyst at Bath Rugby I specialise in attack. Since there are three of us within the first team, we would split the game up. I look into attack with the attack coaches Girvan Dempsey and Ryan Davis, Dan Cooper will do defense with Neal Hatley, and Watkins will do set pieces (lineout and scrums) with Luke Charteris and Mark Lilley.

A day at Bath Rugby usually starts with an early morning meeting, which can be as early as 7am. We are in for the first meeting at 7am to review the training session from the prior day or the game, depending on the day that we come in. We start off with that and then we start looking at how we can review it back with the players, whether that is through a meeting with the coaches or straight onto the pitch to do walkthroughs. After that, we start designing the training for the day. We go through the training, looking at what outcomes we want to get from the session. We then just look through the list of players to see who is available and who is not. My role within that meeting is usually to provide some stats and some visuals, some sort of evidence-based opinion of how the training was and to back it up with what we try to get from that session to see if we achieved our goals. We tend to look at things against our principles. Any aspects of our game that we monitor regularly to check whether we are still developing in those areas. After that part of the meeting is done, I just make sure that I connect up with the coaches or whoever is in the meeting to make sure that we have clips available on the points that we want to get across to the players and to understand what the plan for training is, what filming requirements will be needed and what we are looking to review post training. The meeting starts at 7am and usually is done by 8am or 8:30am.

Once the first meeting is done, we have a moment to get coffee and a little bite to eat. Then usually we have back units training in the morning, which can start at 9am or 10am. That is the first meeting out on the pitch with a big screen to go through clips with the players. I normally just run the laptops while the coaches speak through the clips and direct me through it. Then we go straight into some back units training, where I would film and clip it up afterwards to send it to the other analysts to have a quick review with the coaches and see if there is anything that we need to pick up with the players before the team session in the afternoon.

Once backs units training is done we start planning for the team session. We start thinking about what we are going to need for filming and so on. At the moment with Covid-19, we are not in contact as much with people, so we have to start planning and start identifying what we are going to need beforehand. Also, our pitch at Bath Rugby is not great so we are actually training in a different facility. We start in the morning at our usual base and then have to travel in the afternoon somewhere else for our team session with all the equipment, making sure it is all running. You’ve also got to be prepared for any weather, since you can see, like lately, that it can be sunny in the morning and then start hailing in the afternoon. Your car is usually full since we pack a lot of stuff.

We usually have a couple of hours between sessions. Team training could be at 1pm or 2pm. Within those hours, the big thing for me is to start trying to get ahead of what I need to do. I start looking at the opposition for the week after. If there are any trends in the last couple of games, I get that across the coaches and any of our leaders within the team that need to see them. There is a big emphasis in our club that analysts should not be looked at just as coding monkeys. Analysts have to be present and they get asked questions, making sure we engage with the players, go around chatting with them, not just about rugby but also to get to know them. That is a big emphasis at the club, which makes the rugby chat with the players a lot easier later on.

Bath Rugby is a really good club in that way. You hear stories from players that come to our club and we ask them about an analyst at the club they have just come from and they say “oh, spoke three words to him in 4 years”. For us, as a group of analysts, we are actually really sociable with the players. We make sure we connect with them, get in and around them and we can go through clips with them with honesty. Players then open up to us. If there is anything they don’t see or agree with they would open up and they would trust us quite a lot to pass on that information or not. Those couple of hours in between sessions are good in that sense, to make sure you are not just sitting behind your computer but getting to know the players.

Sports Performance Analysis - Matt Egan Bath Rugby 2.png

For the team session, we get down there with all our equipment and just film it. Then we clip it up, get it online using Hudl for everyone at the club to see, and send it out to the coaches to start the review process. Then it is Groundhog Day again, the next day is the same.

We are always looking directly at the next game. As an analyst, we’ve got to make sure we don’t get distracted too much with other games. You’ve got to make sure that you are still engaged in the week ahead. This weekend for instance, we are playing Newcastle, so I need to look at the game plan for Newcastle and see how it matches to our principles. That is what I’d be reviewing in each session during that week. In-between that, I may get down at looking at the following fixture against Worcester and making sure I’m taking on that end because we might review them at the end of the week. But I need to make sure I’m ready for that without disregarding the game against Newcastle this week.

What is the main highlight of your Performance Analysis career so far?

My two highlights involve England. The first one is the 2016 tour in Australia. It was the first time the England team went to Australia and won 3-0. It was an unbelievable experience doing something you love while being there and it being a success. It was unbelievable being involved in the games and being trusted with live feeding information to the coaches. We were looking at work-rate of certain players, so I was coding it live, feeding it live to the coaches and then substitutions were made on that data. It was an eye-opener and a really good feeling. You can really have a real impact depending on the coaching squad you work with. I’m not saying that whatever I did could have changed the game for the better, it all depends on how responsive and how much your coaching groups trusts you and how much they look at the right things. But you can actually really have a real impact as an analyst and for me that was one of those occasions.

My other highlight was the 2019 England vs Barbarians match. I got invited back to do the match for England. The thing I loved the most about that experience was meeting so many different people. It was a really good highlight being back in camp and everybody there just wanted to enjoy it. It was just a really good week meeting new coaches and new players, something you don’t really ever get to do because once you are in a club, you are in a closed club environment. It was really nice and refreshing to speak with different people, seeing different faces and ending up beating Barbarians at the end as well. From that experience, I’ve built some really good relationships. I am still in contact regularly with one of the coaches and a couple who I still speak to often. It is a nice highlight in a different way.

What are the most challenging aspects of being a Performance Analyst?

One of the most challenging aspects of the role is that when you first come into it, you are really hungry and fresh so you work every hour under the sun and do everything. But then, it is actually one of the most challenging things to pull back from that. You’ve got to be able to pull back from that starting pace, taking out the information that is not being used by coaches. You need to have those conversations with your coaches, making sure that as a squad you know exactly what you are looking for. In the worst case, you are going to spend 9 hours on a review and none of it is going to be used.

Sports Performance Analysis - Matt Egan Bath Rugby 8.png

That is something I have definitely done, even had it at parts of this season. I was spending 3-4 hours reviewing something and ended up producing nothing that just watching the video wouldn’t have already told the coaches. It is really challenging to realise at the time and have that difficult conversation with the coaches. You just tell them that it takes you 4 hours to produce one single number that they use and ask them if that one number is that necessary or could we trim that time down so you could look into something more valuable. Thankfully, the coaches at Bath Rugby are actually really understanding of the timescale of analysis. Although, don’t get me wrong, when the pressure comes, the pressure comes and you get asked to do lots of different things regardless. But the coaches here do ask how long do things take and whether we use them. Sometimes, it is actually down to me to bring it up and I’ve still got to get better at it and bring up things that we produce that I’m not really sure that they get used. It’s a tough one because as an analyst there is a mix of things where you have that drive to make sure you are covering everything because everyone out there is looking for that golden nugget. But it is never out there. There is no winning formula, but we are still searching for it, so you end up digging into things probably far too deep.

The biggest thing is to make sure you take a step back and have a look at what you are working on. The thing that definitely helps is if your club, sport or coaches have a clear idea of how they want the game to look and how they expect it to be played. Then, you can really start narrowing down the areas to look at. But if you don’t have a clear goal and understanding of the principles or the framework, you end up just bouncing around week after week looking for something different each week and produce reports without knowing if the team got any better.

What are the most important skills to have as a Performance Analyst?

I would never underestimate the basics: being able to film, code and distribute information. You would never get told “that’s really good footage” or “that’s really good camera work”, but as soon as you do it wrong, you will get told. You never get told “that is really good coding”, but as soon as you do a mistake in your code, you get told. You always need to make sure you have your Performance Analysis basics right. If you have your basics right, everything else on top is just a bonus. At the moment, a lot of coaches as long as you give them the film and the code that they want they are able to use Hudl Sportscode to do their own little clips. As long as you can supply them with the basics, they are usually quite happy. Giving that extra 20-30% of your own individual skill on top of that is what makes you different from everybody else. But as soon as you don’t hit those basics, you are going to get told.

Another thing is building relationships. You have your technical skills on one side: making sure you know how to work a camera, capture video and, if it goes wrong, problem solve to make sure you always get the footage and work back from there. But on the other side, building those relationships with coaches, with the team, the players is important. You’ve really got to build that trust in the bank for when that one time when it does go wrong and you can’t fix it. Then, the coaches would be “actually, it’s the first time that he got something wrong in about 3 years”. It is going to happen, everyone makes mistakes, but building that relationship and trust can make that conversation more human and understanding.

How is data and analysis being used and perceived at Bath Rugby?

At Bath Rugby, particularly on attack analysis, we use analysis in two ways. We use data for check-ins, to see if we are hitting the targets that we want to hit against our principles each week. We look at metrics over a period of time and see whether they are dipping or getting better and then do work off that, always comparing it to our principles. Then we also have the visual and video side of things. There needs to be a really good blend between the two. If I’m looking at something, you cannot only use video because then you will never identify any sort of trend or pattern and you will never have any weight behind what you say, since you are just showing the instances happening in one game that may change in the next game. Whereas, if you make sure you have your principles right and you are tracking data against them, you can then attach video to it.

Sports Performance Analysis - Matt Egan Bath Rugby 4.png

We also look at wider trends. We’ve always got an eye out on what is happening within our league and other leagues. We use larger datasets using Opta to do little check-ins with that data every so often. All three of us analysts are quite experienced and we can pick up on things in the game quickly. Between the three of us, one of us will pick up on something that they’ve noticed and then we’ll dig a little bit deeper into that using a larger dataset. Once we’ve identified it, we will start looking into the footage of that area.

What are the main tools and technologies used at Bath Rugby?

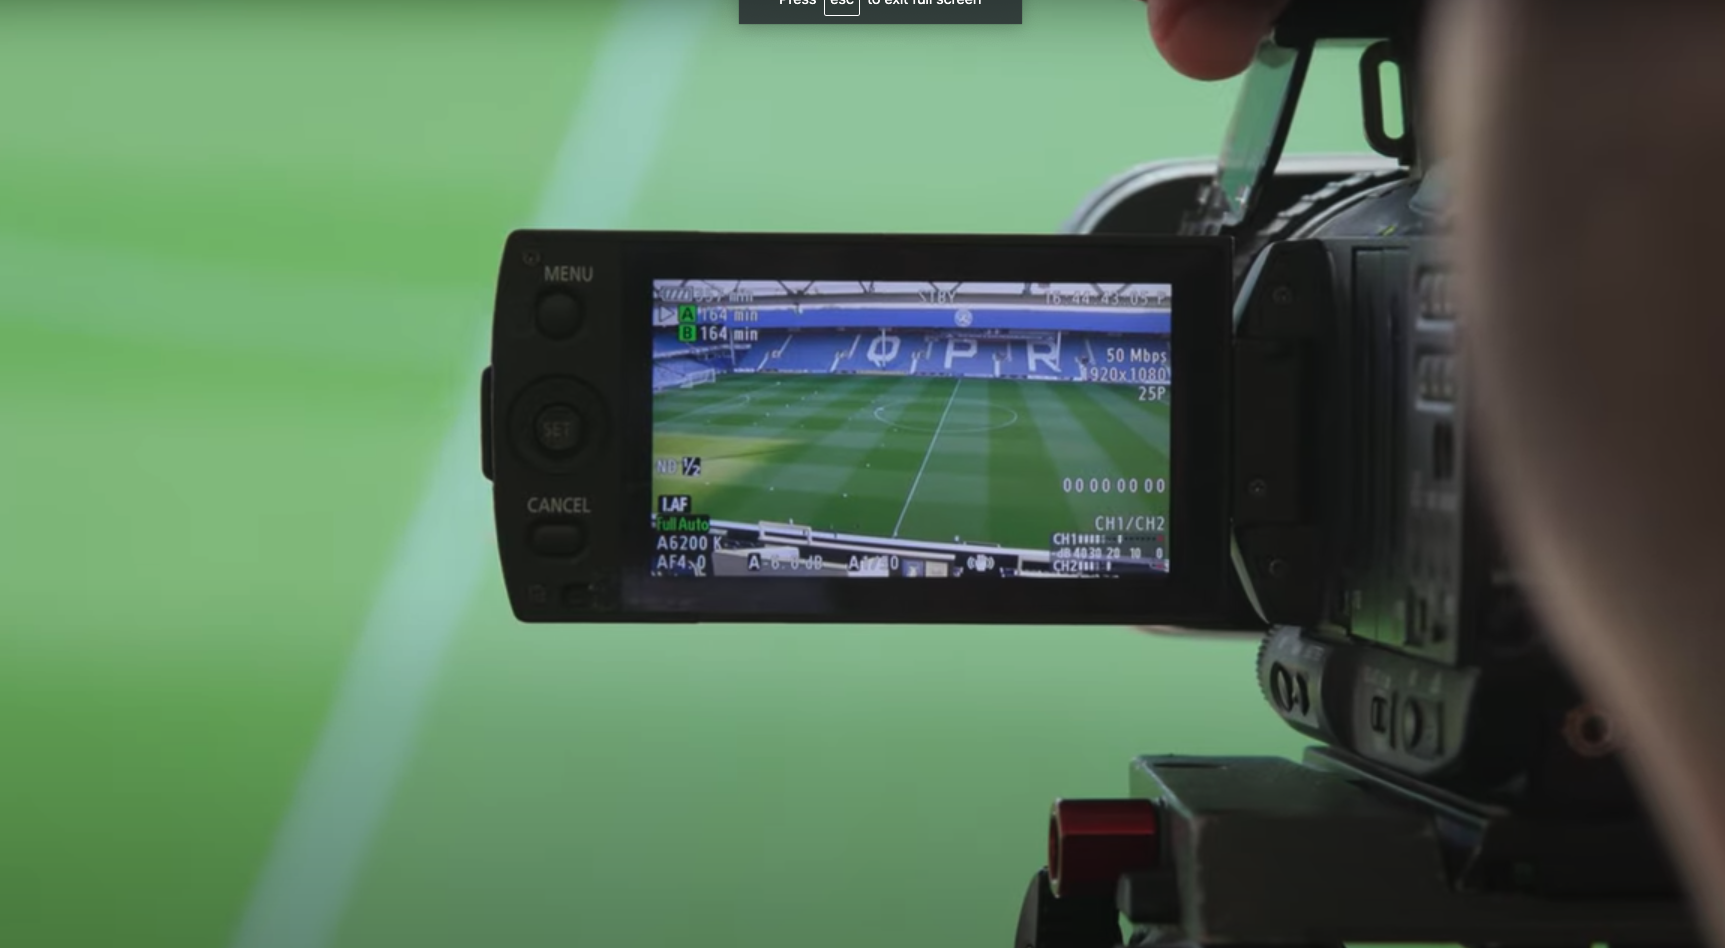
The obvious things like cameras and so on. We have a variety of cameras, the usual recording cameras and then we’ve also got some of the higher poles, small cameras with higher viewpoints. To be honest, those are probably one of the best things we’ve bought. They make it so much easier to film on whatever angle we want. We also use drones, GoPro and also try to capture some audio using some of the small USB audio devices.

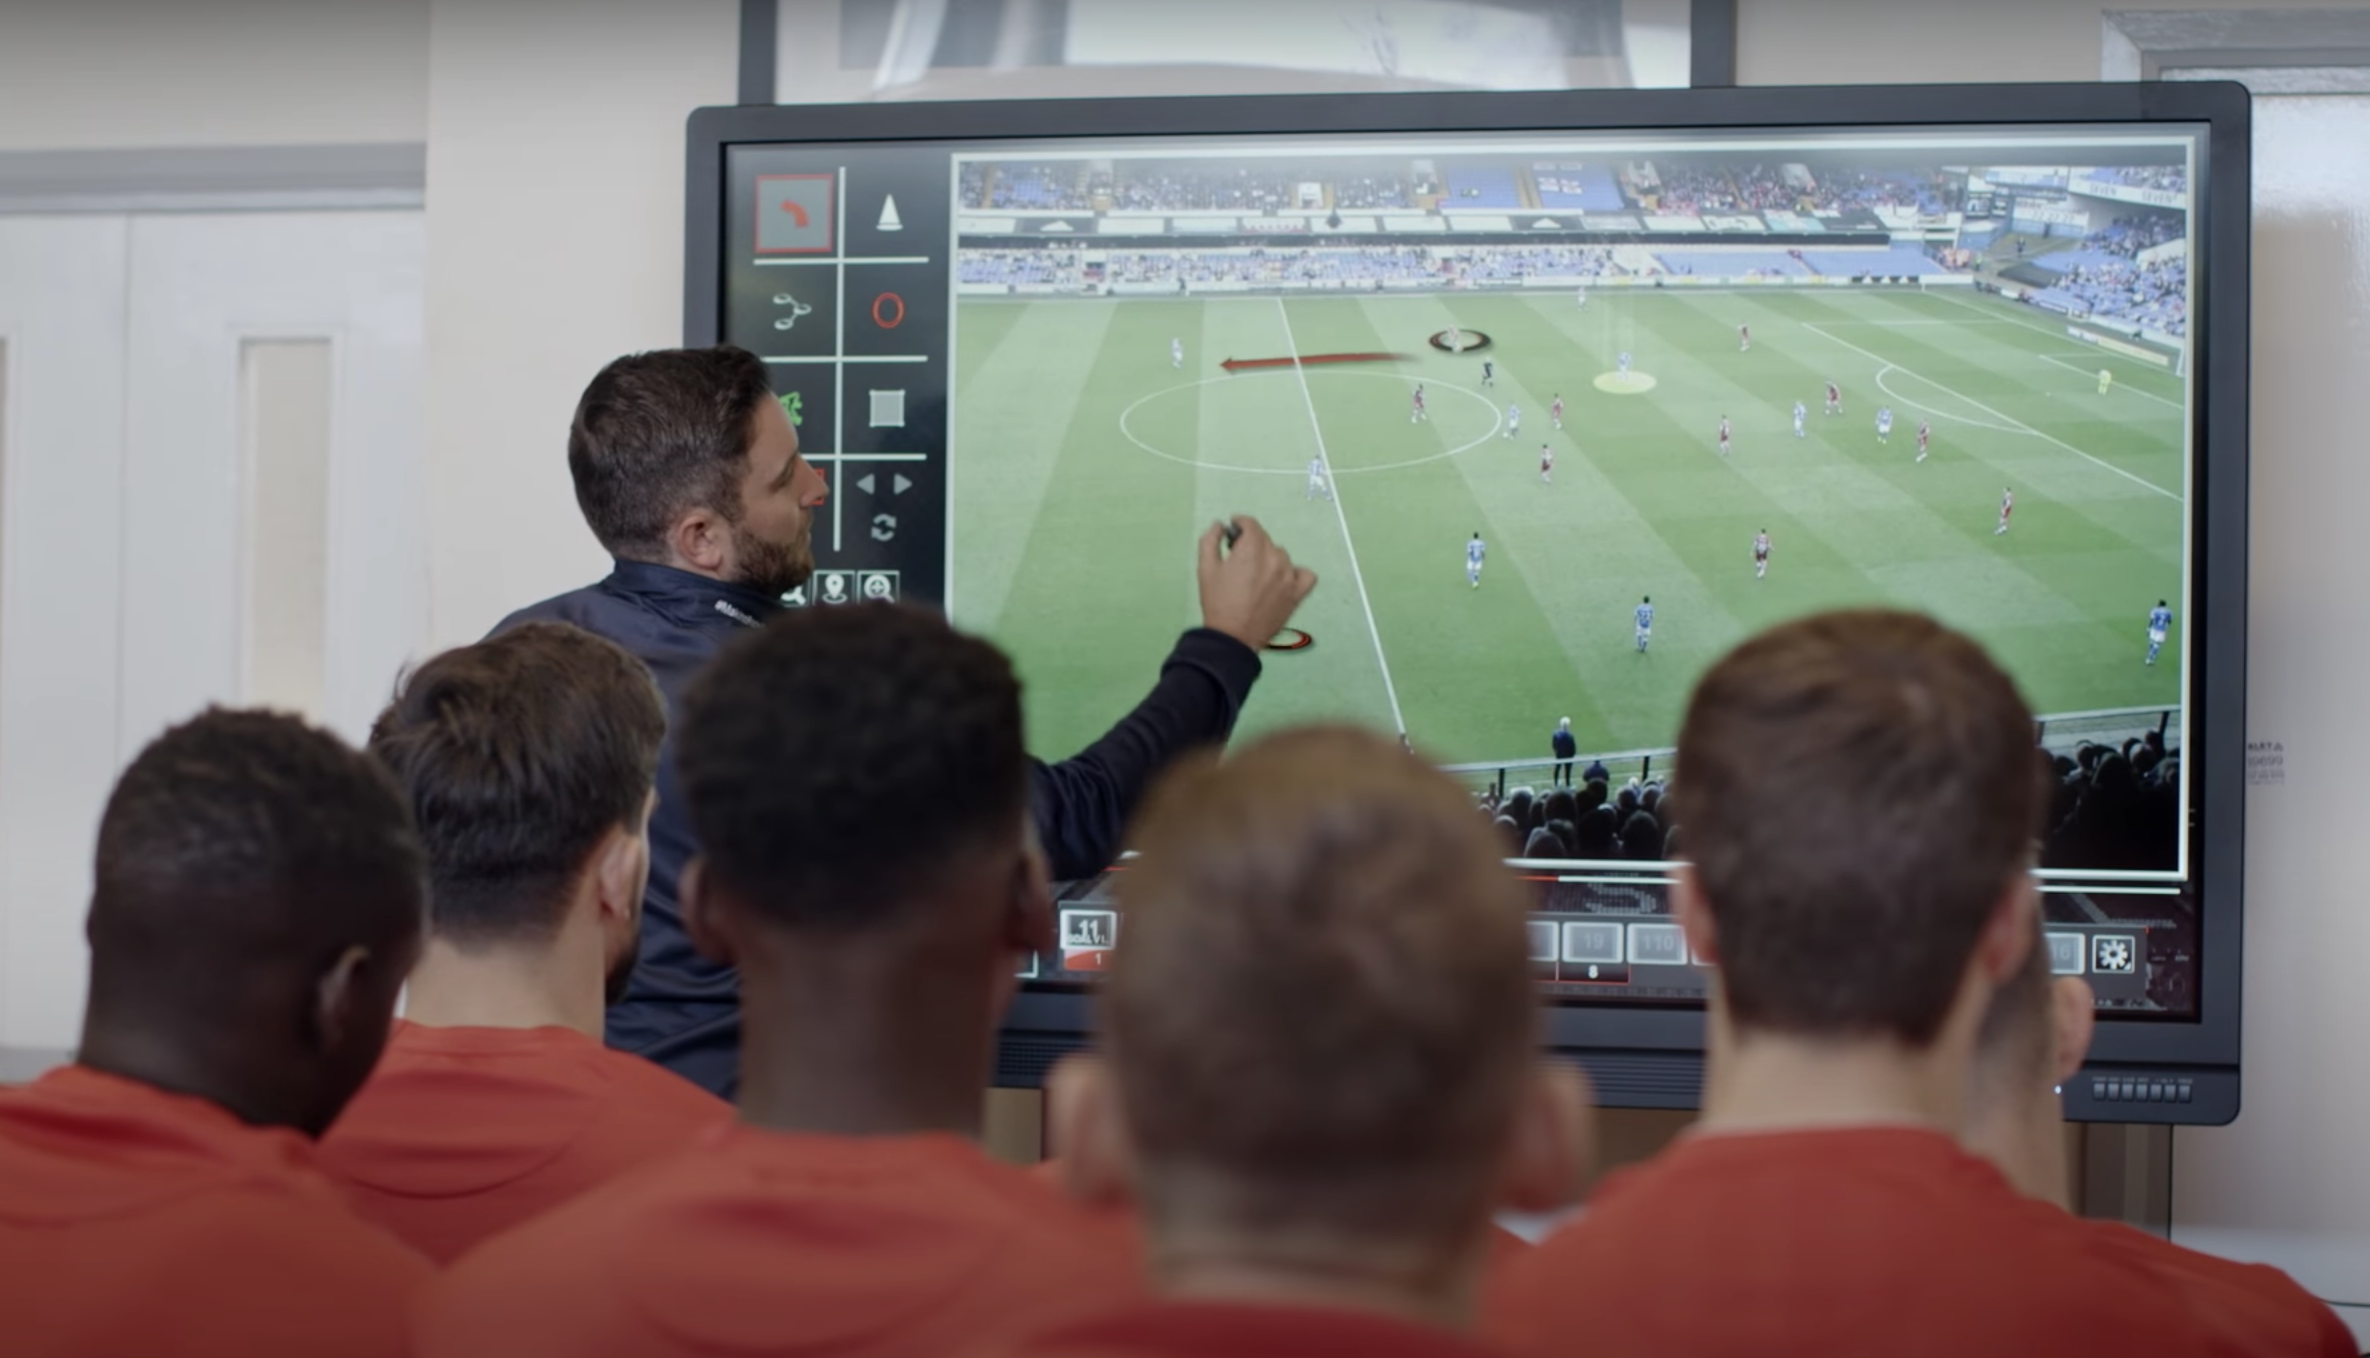
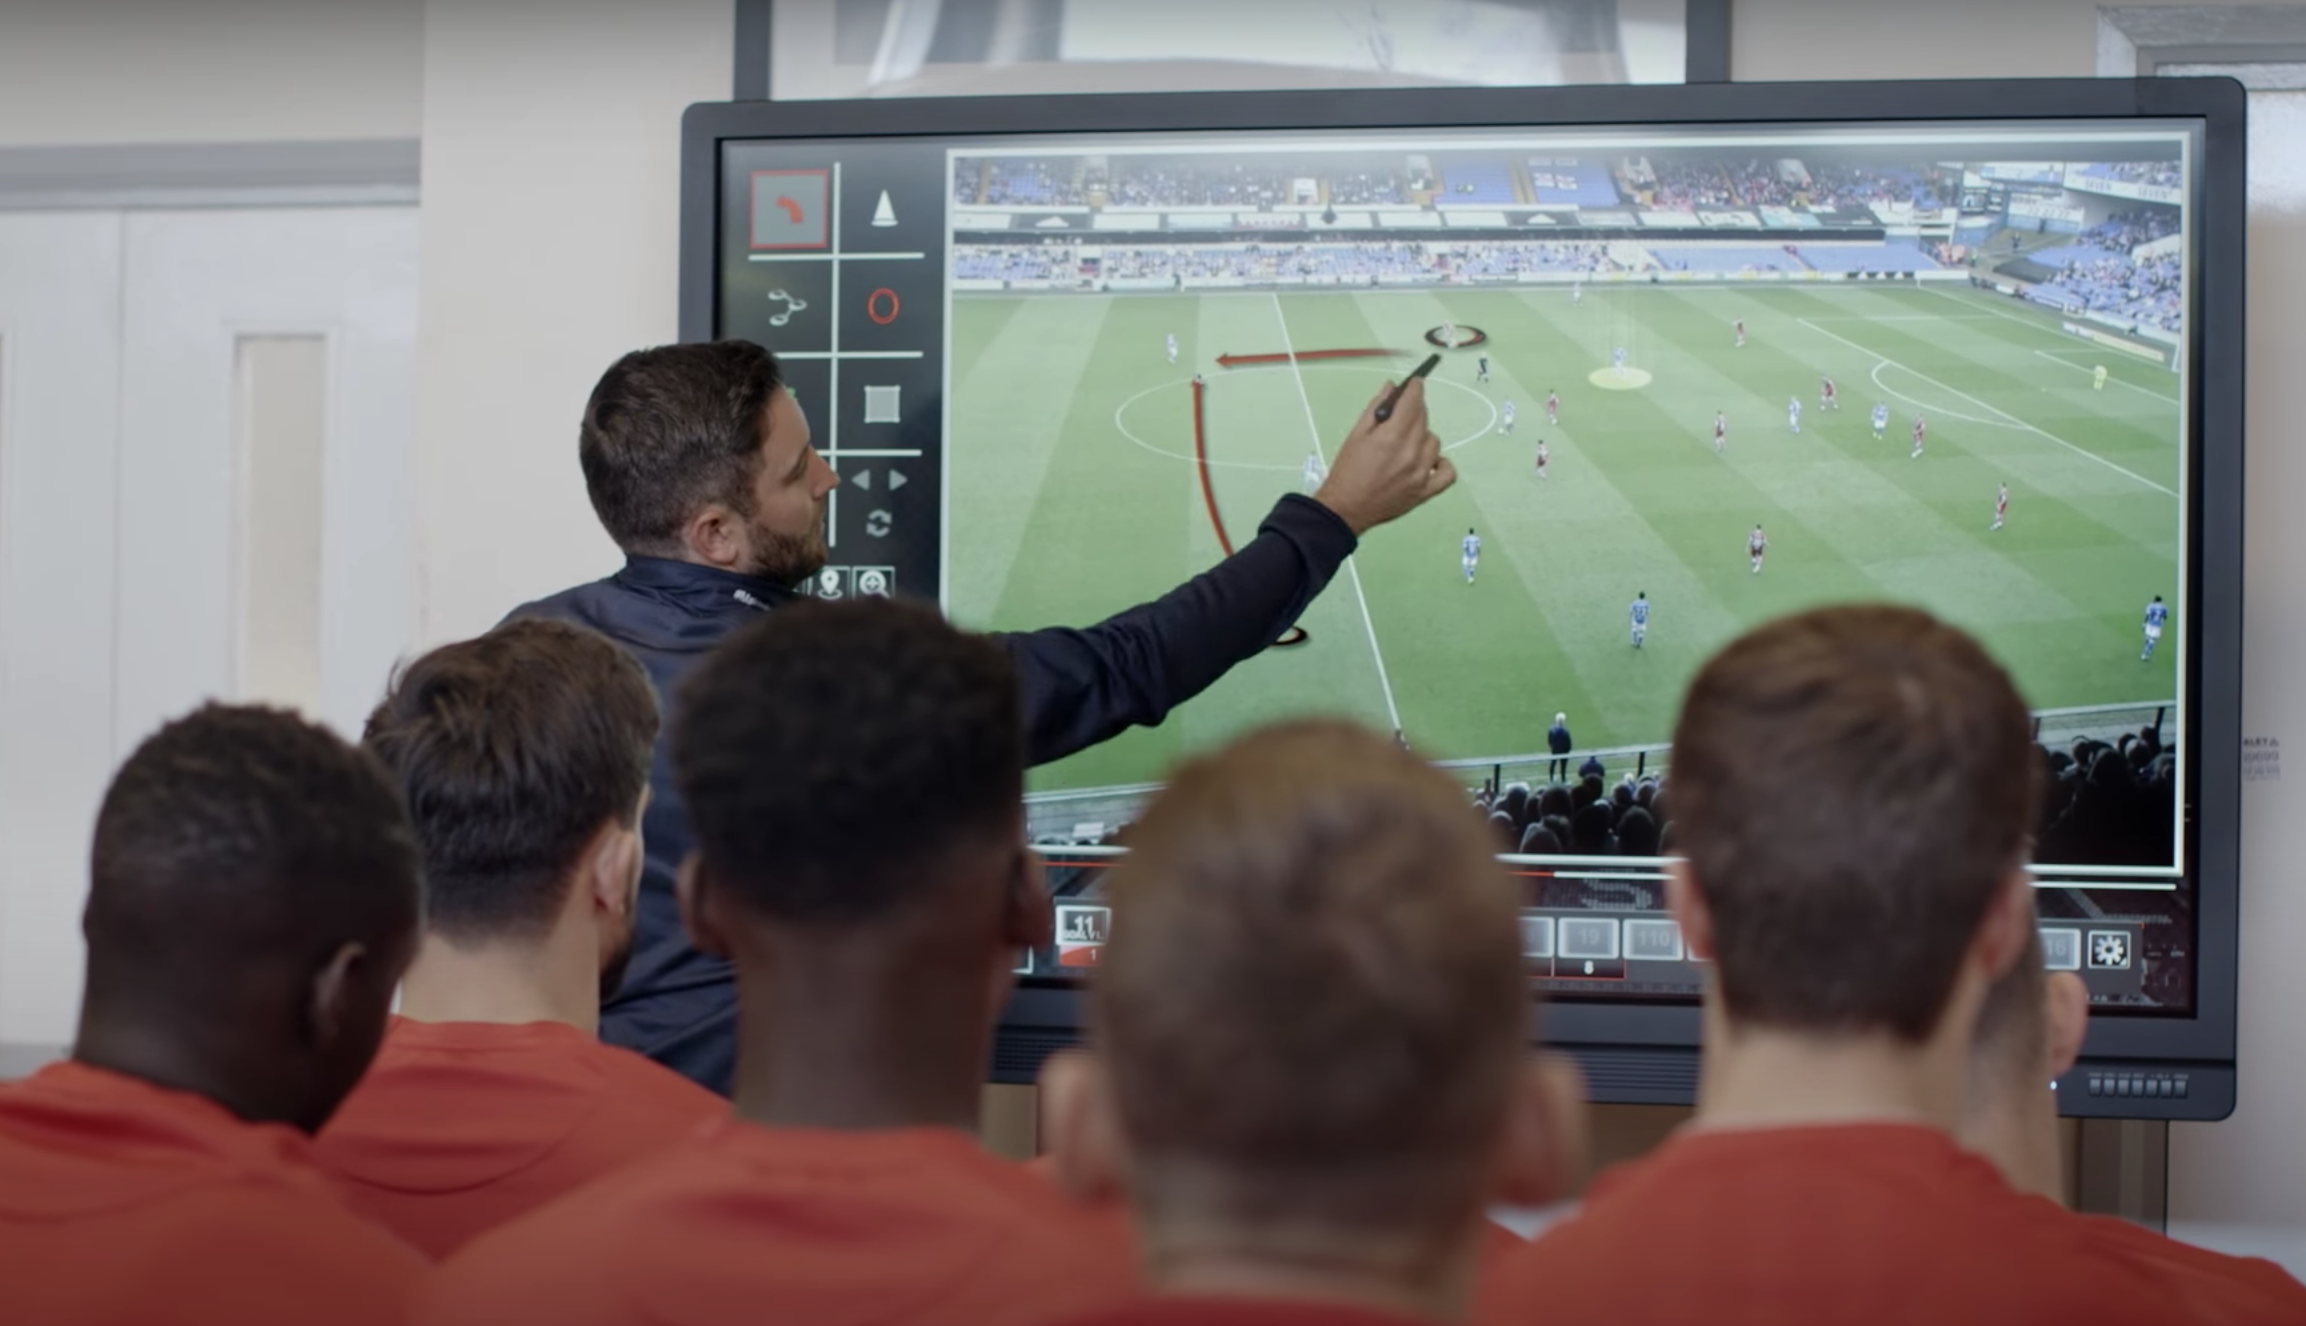
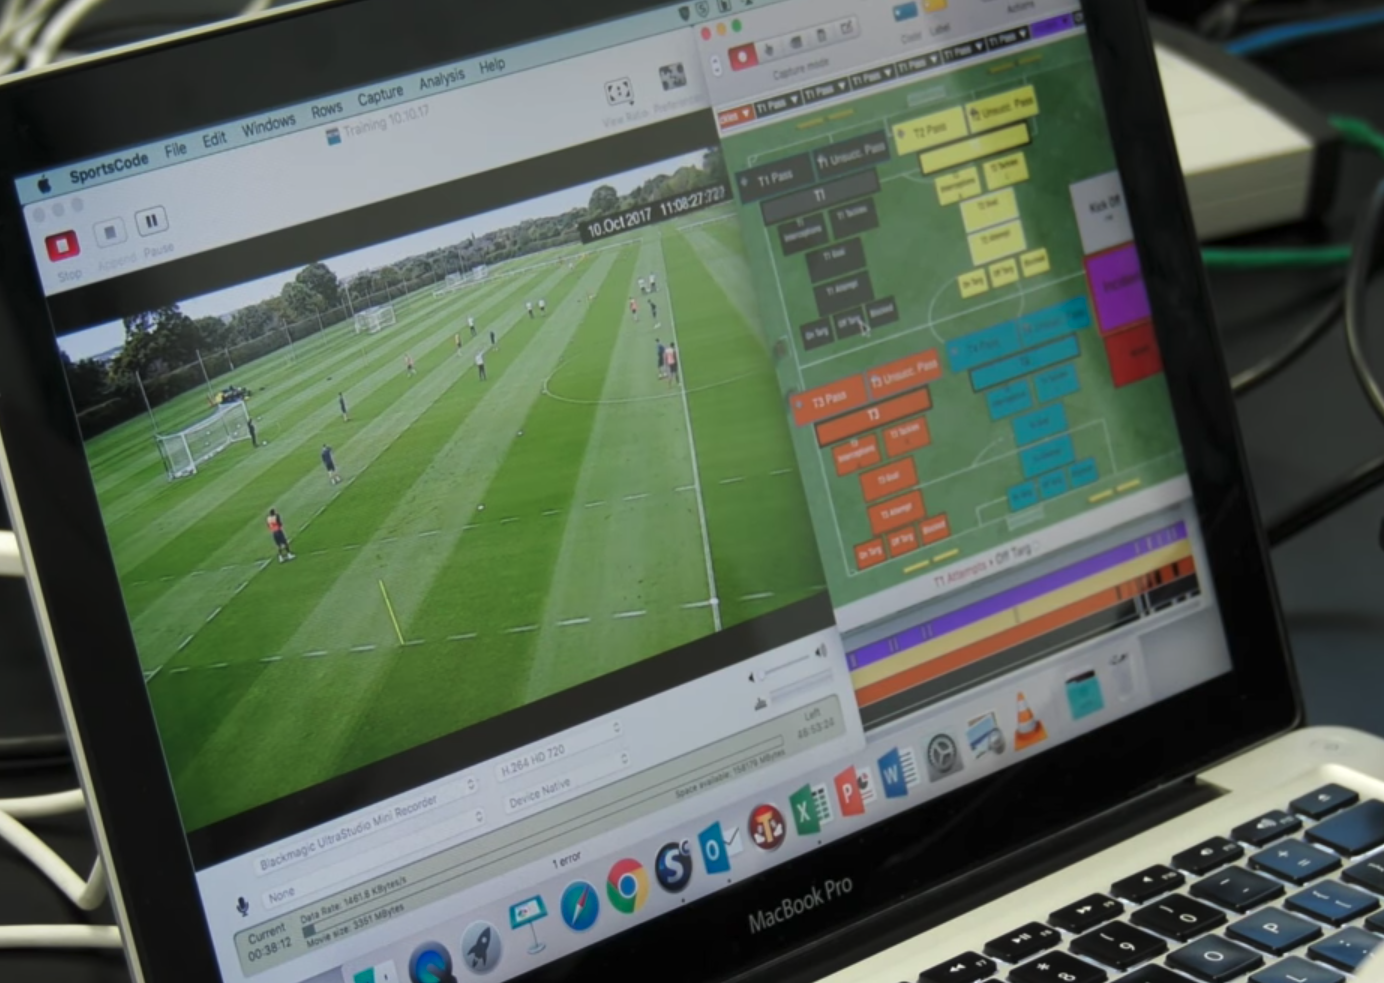
In terms of software, we use Mac applications and Hudl Sportcode. We also use CoachPaint quite a lot. It is really good and looks very professional. We’ve got a few touchscreens, but with Covid-19 we cannot use them at the moment. They are very similar to Gary Neville and Jamie Carragher’s Monday Night Football where you would be able to get a few movies on there, add a few clips, get the coaches and a few of the players and then just ask them questions to get them to start drawing on the screen and start building their understanding of the game around that. They are really good and I look forward to start using them again soon.

Sports Performance Analysis - Matt Egan Bath Rugby 7.png

When it comes to footage, within the league everyone uploads to Hudl. We just download the four camera angles off there, which makes it handy. If there are not there we just grab them off Opta. We use Opta's SuperScout to get the codes as well. Opta has done a really good job at being able to pull the data off their platform. We are able to pull out some stats and compare week on week against oppositions to see if there is something different. We then do our own individual analysis, coding on top of the Opta data to look into how we can apply our game against them.

How do you see the field of Performance Analysis evolving in the next few years?

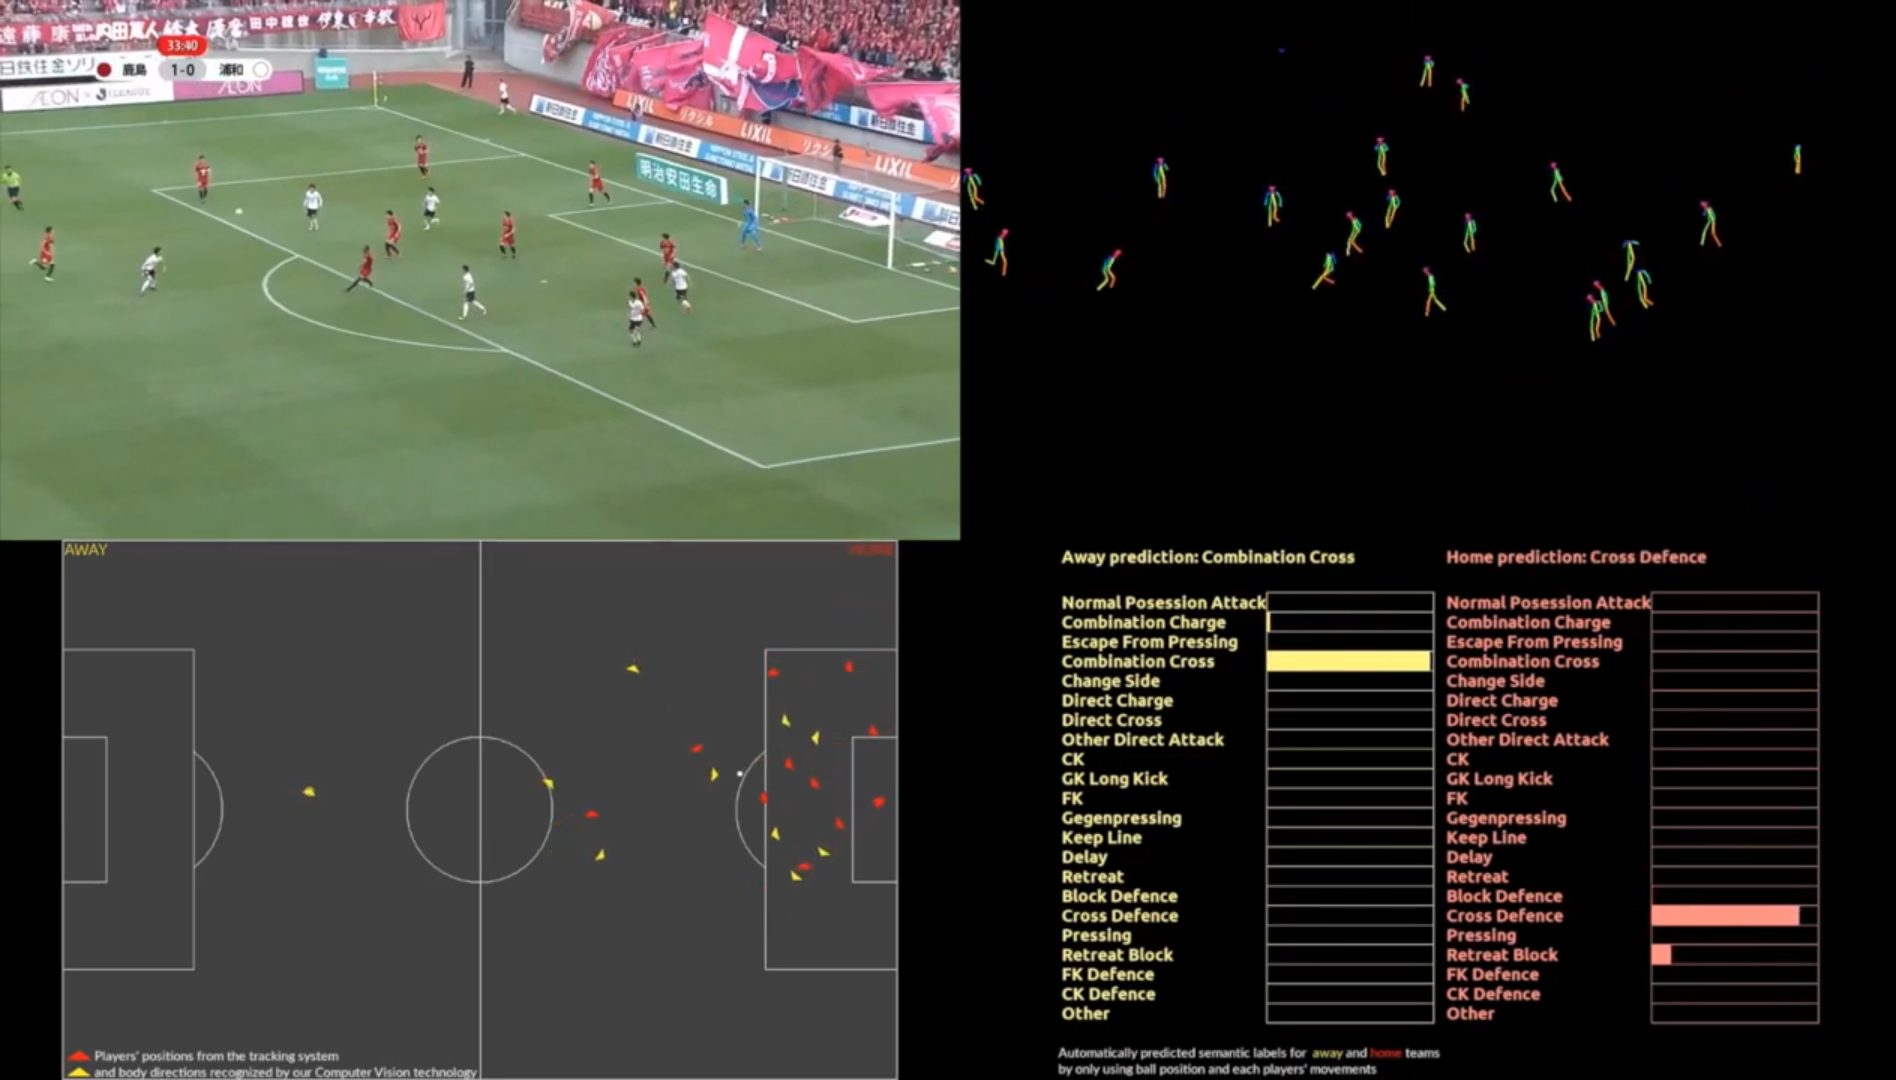
In terms of technology, I see that with some sort of AI technology or similar you will be able to put the players and the coaches into game situations without them having the physical demands of playing the game and then see what decisions they make in different situations. Simulation devices like VR will allow you to just put the device on and be realistic enough that you really start feeling the heart rate go. You will be able to put players in pressure situations where they will have to make instant decisions in the moment. I believe that is where the future is heading.

I also feel that Performance Analysis is going to split into two areas. You are going to have the data side of things and then you are going to have coach-analysts on the other side. Data analysts or scientist are going to be doing all the trends and work on big datasets, looking at data from games everywhere in the world and producing insights from those. Whereas, the coach-analysts are going to be the coaches’ right-hand men to turn the data into common sense. They will be almost like a translators, since it doesn’t matter what figures you pull out, if nobody understands them they are not going to have any impact.

Coaches are actually becoming more proficient with tech. You see some of the older coaches now come in and when they don’t know how to use Hudl they soon feel embarrassed. All the younger coaches that have come through the academy are all proficient with Hudl Sportscode. They all know what they are doing. They pull up organisers, they do the drawing on them, they’ll have their meetings sorted with all their clips ready. Some of the older coaches at times ask about how to do things in Sportscode. It’s really good to see. It is modern-day coaching and as a coach you need to be able to do that now.

What advice would you give to someone looking to become a Performance Analyst?

The advice I’d give someone looking to start is to jump in and get involved. Start getting the basics right. The sooner you can start getting the basics the better. The domain knowledge of the sport is not crucial. To work in rugby as a Performance Analyst, you don’t need to go into it as a rugby expert. You can go into it as a rugby novice and just have basic understanding of the game, but if you can do the basics of analysis (filming, capturing, coding, work to the timeframes, work under pressure) you then learn the knowledge of the game as you do it. You need to make sure you understand that as a Performance Analyst you have to make sure you can film, capture, code and work long hours. If you can do that, then everything else you will pick up naturally.

Once you get the basics right, you need to start working on some emotional intelligence aspects. With coaches, egos get damaged quite a lot and sometimes you have to be there to pick them back up. At the end of the day, even though you are working as a team, the coaches are the ones who get fired if it’s not going well on the pitch, so they have immense pressure. You are there to support them. You need to make sure that you are there as a support mechanism for coaches. You need to challenge them in a supportive way. Ultimately, they are the face of it and the ones who take the brunt. As frustrating as it can be at times in a high-pressured environment, actually all the pressure is on the coach and we are there to support them.

That’d be my advice. Make sure you learn the basics and then start being able to understand the people by building that emotional intelligence and the relationships with the coaches. Emotions run high in professional sports. When they are high they are really high and when they are low they are really low. It jumps between those two states each week and is never stable.

Interview with Alex Scanlon, Men's Performance Analyst at The FA

Alex Scanlon is a Men’s Performance Analyst at The Football Association, where he has been working with development groups since 2017. Alex joined The FA as part of the 2016 initiative to invest in winning England teams by significantly expanding the technical groups that support the various squads. Prior to that, he was a Performance Analyst for Everton’s first team before spending three and a half years working across most age groups in West Bromwich Albion’s academy. Alex tells us about his pathway to become a Performance Analyst for England.

 
Alex Scanlon The Football Association
 

Tell us about your background. What made you want to become a Performance Analyst?

I never really played football recreationally or at a higher level growing up. Only at times, but I never played at a club standard. When I went to college I did play in a national college league, but even though I played often and enjoyed it, I was never that interested in or loved playing. I was always more interested in the other side of the game; the coaching side.

I took my first coaching session when I was 14 years old, when I was still in school. My dad was a primary school teacher and I helped him out a few times at first, then started helping him out more regularly. By the time I was 16 I had my first little under 7s group of players that I would coach every week. I started doing lots of coaching and really started to enjoy the coaching side of football.

I live in Liverpool, where there are two big clubs around. The recruitment of players at that young age is quite tight. Most people from these two clubs are after the same players all the time. Somehow, we managed to get a good group of young lads in our team. Everton asked us to scout for them, gave us a kit and said “if you get any good young players, can you send them to us?”. So I started doing that as well. I managed to get into Everton’s academy and did a bit of development-centered coaching there.

I left school at the start of six form. I hated academics at that age. I wanted a to be more practical, so I left school and went to college to do a Sports Performance course. It was ok. Then off the back of that, I went to Liverpool John Moores University where I did their Science & Football course. It was only there that I started to see the opportunities in football. I got my first role holding a camera and filming games through John Moores University, filming Premier League tournaments. In my final year of the three-year course, I did a part-time internship at Everton with their first team. I was lucky to get that role and do it alongside my third year of studies.

Every year, John Moores University places an intern at Everton’s first team through their programme. I was working with Steve Brown and Paul Graley, who is still at the club. It wasn’t really working at the frontline; it was more working in the background supporting databases and doing that sort of work. It was still within the team’s environment where you could listen to the conversations and see how Steve and Paul worked and got involved on match day. I was also able to travel with the under 18s. I got to travel to a couple Youth Cup games. It was a really good experience, although I think didn’t maximise it when I reflect back on it now. I didn’t get as much out of it as I probably should have. I didn’t put enough into it as I was also trying to do the third year at the university at the same time. Maybe I wish I had asked more questions, studied the work a lot more or reflect a little more about things when I was at Everton. But it was a really good experience at the same time, I took lots from it.

After Everton, an opportunity came to work at West Bromwich Albion via the person that had done that same role at Everton two year prior. They had managed to get a job at West Brom and they knew that the pathway I had been on through John Moores University could be trusted. They knew the type of person that Everton would employed and that John Moores University educates, so they trusted that pathway. The role at West Bromwich Albion was a full-time internship. I moved down there and was living on small wage.

West Brom are really good at moving people up. You start at the bottom and work your way up very quickly. They don’t tend to replace; they try to promote from within so that when someone leaves they bump up from inside the club. For the first 5 to 6 months, I started my weeks doing the under 9s on a Monday, then under 12s on a Tuesday and he under 17s during the day if they were out of school. Eventually, the under 18s analyst moved on and I was given the opportunity to move up quite quickly. I went from doing under 9s to the under 16s programmes, to then do the under 18s and then being the under 23s analysts quite quickly. For most of the 3 and a half years I was at West Brom, I was working with the under 23s team, which is a bit like the first team these days. It was a very good experience, different to Everton as I was in the frontline delivering every game to coaches and players. Another good thing about a club like West Brom is that you end up doing a little bit of everything. You can do some first team stuff, or you can do some support work with the under 18s if they need it. It is quite a small staffed club. I ended up doing a lot of work, which was great for a first full-time job to get that kind of experience and it gave me a good skillset.

After 3 and a half years at West Brom, an England role came up. I applied to it and was successful after the second interview. England were expanding at the time. In 2016, their technical director said that as part of a new strategy everything that looked after the football side (coaching, education, team operations, performance, etc.) was expanding massively with big investments into that area. Winning England teams was a big objective, and putting the structure and the staff around those teams was part of that expansion. As part of that initiative, I applied to the role at the FA and have been there since the start of 2017. The England teams’ development staff was expanding massively. Rather than England using 5 or 6 analysts who go on the road all the time with different teams, they now have an analyst with every age group who can really get down into the detail on that age group, as well as working in other projects.

Alex Scanlon The Football Association

I am now a Men’s Performance Analyst. I work primarily with the development teams, but the role evolves all the time. The last 12 months we have barely been away with the teams. The senior team have played a lot of games, so instead we’ve done a lot of background work for them. Previously, the first 2 to 3 years I was here, we were on the road with the teams quite a lot. That was our primary focus. I’ve done camps with the under 17s, under 18s, under 19s, under 20s and I also did the under 21s European Championship. I’ve also done lots of background and support work for the seniors. That’s what the resources that we have in our department now can afford to do. Even though we try to fix an analyst with an age group to try build relationships with the coaches, if the under 19s were at a final of a tournament, any analyst that is free because, let’s say, the under 18s haven’t got a camp, those analyst would focus on supporting the under 19s at that tournament. If the under 21s are on a tournament we would put the support that way instead, behind the analysts that are on the ground with that team and support them with opposition analysis, game reviews and all of that.

That’s my pathway. I was always interested in coaching and education to develop players rather than playing. The two main parts of my pathway are the work experience from college and university experience and then the coaching side of things.

What is your main highlight in your Performance Analysis career?

My main highlight is the first 12 months that I was at England. We had an unbelievably successful 12 months with the development groups. I was lucky enough to go to 3 of the 4 tournaments that we won. That year, the under 20s won the World Cup, the under 17s won the World Cup, the under 19s won the European Championship and we had a hybrid under 20s groups also won, and I managed to go to three of them. That was definitely an unbelievable year in terms of results and emotions. Professionally for me, it was also an eye opener. I developed a lot that year. I learned how to work differently and in an international setting. It was not only successful for the teams that I worked with but my development and experiences went through the roof.

Alex Scanlon The Football Association

You may look at international football and think that it has only got 10 games a year, but that year I did 3 major tournaments, about 27 games along the road for 200 days of the year. There was so much to learn from that year. I developed a lot mainly around the analysis process. Working in a club is a different kettle of fish. You’ve got your equipment at the club and you just take what you need to the game and then it comes back to the club. Whereas with England, we went to India for 5 weeks with the under 17s and we had to take everything that we might need with us. Logistically it was a big planning operation. We also were two analysts that went out to India so we had to plan how we would work together, how we would fit in the tech groups in the squad, how we would work every day, how we would provide information to the players, how we would get the players to think about what we would want them to think about, how we would get them to talk, etc.

At a club, you get stuck in the game cycle. You are constantly preparing for the next game. Whereas for India, we were able to plan 2 to 3 months in advance and get really into the detail of what we were going to do and how we were going to work. That level of detail that we went through was a massive eye opener for me. We were very well prepared and missed no training sessions. We were so ahead of the curve in terms of preparation that the next morning after the game we could watch our game back, we could feedback and talk to the players and coaches and we could then watch the next opposition very quickly, also because we had that support coming from back home. We were able to do matchday+1, so that next time we train with the players we were preparing and learning way ahead of schedule.

At West Brom, I was delivering stuff on a Thursday afternoon for a Saturday game, which when I look at it now, I think “how did that ever work? It is too late to deliver something”. England was a big jump in level for me. At West Brom, you work day to day, game to game, but you don’t get a chance to take a step back and think “are we doing the right thing? Is this the best way of doing things? Are we maximising what we’ve got?”. Whereas with England you definitely get that opportunity to reflect. You definitely have to prepare and make sure you are on it, because you will get tested. Operationally, England was another level.

The intensity with England peaks and drops a lot more compared to a club, where it is a bit more levelled. At a club, you have a more stable level of intensity and get by and have an impact game by game, week by week. However, the intensity during a tournament with England goes through the roof because you are still expected to deliver at a high level. The intensity is mad on camp, specially the turnaround. It is so important for us to be ready for the next game having learned and reviewed the previous game. You don’t get 6 or 7 days that you would get in a club. Instead you get 2 days in between games. If you win the semi-final you’ve got to prepare the final straightaway, on top of the travel to change venues and locations. We were flying across India in our travel days and had to think about how we maximise that travel time. The intensity at international level when it peaks, it really peaks.

What are the most challenging aspects of being a Performance Analyst?

For us with England we try to change the way analysts are viewed. We want to come away from just doing the clips, the codes and the filming to really have a real impact. That is not to say that analysts don’t have an impact, of course they do. We just wanted to shape our roles to come out of that traditional view of an analyst a little. When previously there were 5 or 6 analysts constantly going around the different age groups, we now want to have a real focus and build a technical group of staff that include coaches, analysts and performance coaches to really have an impact in each group. We don’t want to just provide information to coaches, we want to challenge them and give them more informed insights. We give them better information, and if they disagree with it, it is fine. If you disagree with them, it is also fine. With England there are no hierarchical considerations when it comes to analysis.

Getting that message across the line was the main challenge for us. We were trying to change the culture around analysis while changing the way it operates. We wanted coaches to be similar to what you see in Rugby, coaches that take a lot of ownership of their content, letting them study and teach them how to produce their own clips. Educating coaches on how we work and explaining how they could take some of that work themselves became a big part of our role. Getting the coaches buy in and getting the shift towards coaches taking a lot more ownership over the analysis-type of work has been the biggest challenge of our role up to now.

What are the most important skills as a Performance Analyst?

It is important to be good with key analysis technology, to be efficient with your work and to make sure you are having an impact with the level of detail that you are offering coaches and players. A massively important skill that could often get overlooked is being a good communicator. You have to be involved in the conversation and make sure you are able to judge a room and a set of coaches. It is important that you build those relationships with coaches where you can, so that you can challenge them and comfortably say “I disagree, I think there is a better way of doing this, I think this is more important for this next game as oppose to that”. You definitely need to build your credit by being good at your job. I don’t think you can get away from that. What takes you to the next level in Performance Analysis is that impact, the communication, the clarity, the detail and making sure you can get your point across in a concise way.

How is data and analysis being used and perceived today at The FA?

At The FA, we would try to get the coaches to do a lot of the subjective analysis, where they look through clips themselves without needing an analyst. Analysts would then bring objectivity to that meeting. We would bring the objective angle by bringing the data, whether we are coding it ourselves or bringing it from a third party. We may also provide subjective opinions too when we are trusted with that, but we would primarily want to provide that objectivity. That is the piece that we are responsible for in that setting. Coaches are responsible for the technical and tactical stuff, but we would provide our input by supporting or challenging their message with data.

Data is the biggest thing that is coming in sport. There is so much of it. The most important thing for an analyst is to be a translator of data. You need to be good at the software that looks at data, writing scripts or designing outputs. It is important that you can look at data and translate it into something meaningful. We are in a place where so much data is available that the real skill is to find the good bits from it, being able to find a pattern that you can trust and that has an impact on how you work and what you do.

In terms of how data is delivered to the coaches at The FA, it is really difficult to do it on the road but it is definitely in our processes. Even though we try to incorporate our data on the road, it’s one of those situations where it is really challenging to find the right time and the right way to do it. We try to do it subtly, for example, we try do it one-on-one with the coaches or players. We never really put up charts of data on the screen. We don’t dissect information in that way as a group. If there is a point to be made about something that will support or challenge a decision, then we would make it with either data or footage.

Data has more of an impact off-camp, when we can get into the numbers, study them and build analysis to tell a story with it. You don’t really have that time when you are on the road. When we do, we look for key indicators that we can trust and compare them with the metrics that we normally use and benchmark with. We have some Tableau outputs that we use to visualise data. We are able to use tools like that, but the challenge is finding the right time. You also don’t want to be a person that produces a graph and that’s it. You want to have an impact by providing more meat on the bone. We have way more impact with data when we are off-camp and we can do projects, study and do really good comparisons. However, we do have the tools to be able to use it on-camp if we want to have a very quick look on specific stats. That is the way we use it when on-camp.

In general, we tend to use more video than data. This is probably because it follows the flow of how we give feedback to players and what we show them. We are normally going to be showing them some video examples and talk about the game rather than get into the mud with the data with them. Having said that, data tools are there for us to use as analysts, and the coaches do listen to the data. They are receptive to it if they can see the value and is communicated well and it is translated into their language. That is why translation and communication is massive as an analyst. 

What are the main tools and technologies you use in you analysis?

At The FA we utilise Hudl. We use SportsCode and Hudl’s online platform to house and share video with players and coaches. We also have Hudl Replay for live video in the game. We utilise Hudl packages quite a lot. All the coaches have SportsCode licenses on their laptops as well as the analysts. We try to include SportsCode into coaching education courses and give coaches some licenses so that they can get on their laptops and use it as part of their development. We also use CoachPaint if we want to do illustrations, since it has various ways of doing them. We also collaborate online by sharing documents and game plans. We used to use Google to share documents online but have now moved on to Microsoft. We also use Tableau to manipulate and present data.

In terms of footage, as much as we can we try film ourselves so that we know we can trust our own footage. The level of support in international football is quite mixed. You have some teams that don’t have an analyst at all and just have someone filming the game for them for the day and that’s it. Then there are other nations that are similar to us and are heavily resourced. So as much as we can we try film ourselves. Although, UEFA do a really good job at trying to provide footage for the tournaments, same as FIFA, but it is not always reliable and you are not always playing in a UEFA or FIFA competition either. In the cases where we can’t film a game, we’ve got good relationships with some nations who we exchange footage with. We are really open to sharing because we’ve got nothing to hide in terms of footage. The good thing is that we get a wide angle from most of our opposition teams.

What does the future of Performance Analysis look like?

Data is the next big thing in Performance Analysis. There is lots of it at the minute but we only use a fraction of it. There are lots of companies and third parties that are doing very cool stuff. Some organisations code in-house like we do. The skills needed will be people who can refine it, study it and pick out useful information from it, as opposed to just collecting it and looking at it.

Finding useful information from the data is key. If you are not skilled at Python or R, there is still a place in the translation of the data and the presentation and delivery of it to coaches and players. The role of an analyst will need to evolve that way because a lot more coaches, especially the younger coaches that are coming through now and managers at the top level are all proficient on their laptops. Coaches don’t need an analyst just for the clips because they now can do that themselves. Analysts need to add value in a different way and data analysis is where I see it going towards.

What advice would you give to someone looking to get into Performance Analysis?

There are so many ways to get into Performance Analysis. There is not just one way of doing it and I don’t think there is a secret to it either. As much as you can, get out there. If you are at university, just offer yourself. You might have to do work free of charge just to get that experience at first. A lot of people have done that and will carry on doing that. It is how you make yourself stand out as a candidate for when you do look for your next job and get the opportunity.

There is nothing stopping you from watching football on TV and doing tactical reports. There is also nothing stopping you from getting hold of data, there is so much free data that is out there if you’ve got the skills to use it. Nothing stop you from getting hold of that data and doing some work with it. There are enough platforms to get data out there and there is a big community online, like Twitter. You’ve got to put your work out there and when the opportunity comes, take it and don’t look back.

The one thing that I’d take from my career so far is when I was very split of whether I moved down to Birmingham and work for West Brom or not. The money wasn’t great to live on but it was a good internship. I ended up doing it and that decision paid off in terms of the pathway that then followed because of that. You don’t get many opportunities so if you get one, take it.

Artificial Intelligence (AI) in Sports

Dr Patrick Lucey is the Chief Scientist at Stats Perform and has over 20 years of experience working in Artificial Intelligence (AI), in particular face recognition and audio visual speech recognition technology. He also worked at Disney Research (owners of ESPN) where he developed an automatic sports broadcasting system that tracked players in real-time by moving a robotic camera to capture their movements.

Patrick recently talked about the use of Artificial Intelligence in sports, what that means and how we can use AI to help coaches and analysts make better decisions in sport. Artificial Intelligence refers to technology that emulates human tasks, often using machine learning as the method to learn from data how to emulate these tasks. His talk emphasised on the importance of sports data, and provided an overview on the different types of sports data that exist today. Patrick explained what is meant by AI and why is AI needed in sport.

Stats Perform is one of the leaders in data collection in sports, offering a wide range of sports predictions and insights through world-class data and AI solutions. For over 40 years, they have been collecting the world’s deepest sports data, covering over 27,000 live streamed events worldwide with a total of 501,000 matches covered annually from 3,900 competitions. This huge coverage translates into the collection of billions of unique event and tracking data points available in their immense sports databases. To make use of this invaluable dataset, Stats Perform has created an AI Innovation Centre that hired more than 300 developers and 50 data scientists to create a series of AI products with the goal of measuring what was once immeasurable in sport.

Different Types Of Sports Data

Patrick and the Stats Perform AI Innovation Centre have worked on a wide range of different types of data to make predictions on a number of different sports, from football to field hockey, volleyball to swimming using different types of data. There are 3 main types of sports data available: box scores, event data and tracking data. All these types of data facilitate the reconstruction of the story of a match or a particular performance. However, the more granular the temporal and spacial data of a game is, the better the story an analyst can tell.

Box-Score Statistics

The use of high-level box-score statistics (half-time match score, full-time match score, goal scorers, time of goals, yellow cards, etc.) can summarise a 90-minute match of football to provide an idea on how the game was played in just a few seconds. Basic box-score statistics can tell you who won the match, which team took the lead first, when were the goals scored and how close together to each other. Box-score statistics provide a fairly good snapshot of a game and a decent level of match reconstruction.

Box-score statistics Sevilla vs Dortmund (Source: Sky Sports)

Box-score statistics Sevilla vs Dortmund (Source: Sky Sports)

Box-score statistics also offer a more detailed level of information. For example, they can illustrate which team had more shots and the quality of those shots by showing the number of shots and shots on goal. They can also explain the distribution of possession between the teams in the match, which team had more corners, committed more fouls, made more saves and so on. Within a few second they can capture the story of the match, which team dominated or how close was that game.

Detailed box-score statistics Sevilla vs Dortmund (Source: Sky Sports)

Detailed box-score statistics Sevilla vs Dortmund (Source: Sky Sports)

Event Data

Event data, or play-by-play data, provides a bit more detail than box-score statistics by offering additional contextual information of key moments during a match. For examples, play-by-play commentary of a match can offer textual descriptions of what occurred at every minute of the match. Similarly, spacial data of the game (i.e. spacial location of players) can provide visual reconstructions of some of the key events in a match, such as how a particular goal was scored. While it is not the same as watching the video, it is a quick digitised view of the real-world play that can be reconstructed in seconds.

Text commentary of Sevilla vs Dortmund match (Source: Sky Sports)

Text commentary of Sevilla vs Dortmund match (Source: Sky Sports)

Stats Perform, particularly through Opta, is one of the industry leaders in event data collection. They provide event data to sportsbooks through a low latency feed that tells them when a goal, a shot, a dangerous attack or any other key moments occur in close-to-real-time so that the sportbooks can relay that information to their bettors. In these cases, speed of data is crucial, not only to reconstruct a story of what happens on the field through data but to be able to tell that story almost imminently.

Tracking Data

Tracking data is currently the most detailed level of data being captured in sports. It enables the projection of the location of all players and the ball into a diagram of the pitch that best reconstructs a match from the raw video footage of that match. Having a digital representation through tracking data of all players on the entire pitch enables analysts to perform better querying than simply using a video feed that only displays a subsection of the pitch.

Tracking data plotted into a diagram of a football pitch (Source: Patrick Lucey at Stats Perform)

Tracking data plotted into a diagram of a football pitch (Source: Patrick Lucey at Stats Perform)

Sources Of Sports Data

Video Footage

The vast majority of data types are collected via video analysis. Video analysis uses raw match footage as the foundation to either manually observe or automatically capture (i.e. computer vision) key events of the match to generate data from. Today, all three types of sports data (box-score, event data and player tracking data) are fundamentally based on video. However, more recently new technologies have been gradually introduced into various sports to collect great details.

Radio Frequency Identification (RFID)

The NFL is now using Radio Frequency Identification (RFID) wearables implemented on players’ shoulder pads to track x and y coordinates of each player’s location on the field.

Radar

In golf, radar and other sensor technology has also been implemented to track the ball’s trajectory and produce amazing visualisations with very accurate detection of the ball.

GPS Wearables

Football and other team sports use GPS devices that, although not as accurate as RFID, can track additional data from the athlete, such as heart rate and level of exertion. These wearable devices have the advantage that they can be used in a training environment as well as a competitive match.

Market Data (Wisdom Of The Crowds)

Market data in sports usually refers to betting data. It is an implicit way of reconstructing the story of the match that relies on people coming up with their predictions where information can be mined from.

AI-Driven Sports Analysis

Sports analysis has traditionally been based on box-score and event data. All the way from Bill James’ 1981 grassroots campaign Project Scoresheet that aimed to create a network of fans to collect and distribute baseball information to Daryl Morey’s integration of advanced statistical analysis in the Houston Rockets in 2007.

However, in the 2010s, tracking data began to set a new path to new ways of analysing sports. Over the last decade, a new era of sports analysis has emerged that maximises the value of traditional box-score and event data by complementing it using deeper tracking data. The AI revolution in sports thanks to tracking data has focused on three key areas:

  1. Collecting deeper data using computer vision or wearables

  2. Performing a deeper type analysis with that tracking data that humans would not be able to do without AI

  3. Performing deeper forecasting to obtain better predictions

Collecting Deeper Sports Data

The main objective of collecting sports data is to reconstruct the story of a match as closely as possible to the one seen by the raw footage that a human or a camera can see. The raw data collected from this footage can then be transformed into a digitised form so that we can read and understand the story of the match and produce some actionable insights.

The reconstruction of a performance with data usually starts by segmenting a game into digestible parts, such as possessions. For each part of this game, we try to understand what happened in that possession (i.e. what was the final outcome of the possession), how it happened (i.e. describing the events that led to the outcome of that possession) and how well it was done (i.e. how well were the events executed).

Currently, the way play-by-play sports data is digitised from the video footage is through the work of video analysts. Humans watch a game and notate the events that take place in the video (or live in the sports venue) as they happen. This play-by-play method of collecting data produces an account of end of possession events that describes what happened on a particular play or possession. However, when it comes to understanding how that play happened or how well it was executed, human notational systems do not produce the best information to accurately reconstruct the story. Humans have cognitive and subjective limitations when capturing very granular level of information manually, such as getting the precise timeframe of each event or providing objective evaluation of how well a play was executed.

In-Venue Tracking Systems

One way tracking data can be collected is through in-venue systems. Stats Perform uses SportVU, which was deployed a decade ago as a computer vision system that installed 6 fixed-cameras on a basketball court to track players at 24 frames per second. Their newer version of SportVU is now widely deployed in football. SportVU 2.0 uses three 4K cameras and a GPU server in-venue to collect and deliver tracking data at the edge in real-time.

Stats Perform SportVU system on a basketball court (Source: Patrick Lucey at Stats Perform)

Stats Perform SportVU system on a basketball court (Source: Patrick Lucey at Stats Perform)

However, tracking data has a main limitation: coverage. While tracking data provides an immense number of opportunities to do advanced sports analytics, its footprint across most sports is relatively low. This is because for most in-venue solutions a company like Stats Perform requires to be in the venue with all their tracking equipment installed. This is problematic when increasing the coverage of tracking data across multiple events across the world, as it is not realistic to have sophisticated tracking equipment installed in every single pitch, field, court or stadium across the world to cover every single sporting event that takes place every day.

Tracking Data Directly From Broadcast Video

To overcome the limited coverage of in-venue systems, Stats Perform are now focusing their AI efforts in capturing tracking data directly from broadcast video, through an initiative called AutoStats. It leverages the fact that for every sports game being played, there should be at least one video footage of that event being recorded and potentially being broadcasted. The way of getting the best coverage of tracking data is capturing the data directly from broadcasting footage.

PSG attacking play converted to tracking data from broadcast footage (Source: Patrick Lucey at Stats Perform)

PSG attacking play converted to tracking data from broadcast footage (Source: Patrick Lucey at Stats Perform)

This means that the way tracking data is being collected is now evolving away from in-venue solutions to a more widespread approach that uses a broadcast camera. However, the advantage of using in-venue solutions is that you only need to calibrate the camera once. When collecting tracking data off broadcast, you need to calibrate the camera at every frame because it is constantly moving while following the play.

Computer vision systems that collect tracking data directly from broadcasted video footage follow three simple steps:

  1. Transform pixels in the video into dots that represent trajectories of the movement of players and the ball. These dots can then be plotted on a diagram of the field for visualisation.

  2. The trajectories generated from the movement of the dots over a space of time can then be mapped to semantic events in the sport (i.e. a shot on goal).

  3. From the events identified, expected metrics can be derived to explain how well does a player execute on a particular event (i.e. Expected Goals).

Converting Pixels To Dots

Converting video pixels to dots refers the process of taking the video footage of the game and digitally mapping each player movement to trajectories that can be displayed on a diagram of the pitch in the form of dots. The main advantage of this method is the compression of the footage. An uncompress raw snapshot image of a game at 1920x1080px from a single camera angle can be as large as 50MB, which means video footage of that game can be as large as 50MB per frame. If instead of one camera angle you have 6 different camera angles, the data file size multiplies to around 300MB per frame. This is an incredibly high amount of high dimensional data, but not all of it is useful for sports analysis.

Conversion of video footage pixels into dots on a diagram (Source: Patrick Lucey at Stats Perform)

Conversion of video footage pixels into dots on a diagram (Source: Patrick Lucey at Stats Perform)

Instead, tracking data representing players on the court or pitch in the form of dots can substantially reduce the size of each frame. For example, in basketball, 10 players, 1 ball and 3 referees can be plotted with their x, y and z coordinates in a digital representation of the court with a size of 232 bytes per frame. This makes tracking data the master compression algorithm on sports video with compression rates of 1 million to 1.

The advantages of using tracking data instead of raw video footage is that it allows to query the dots instead of the pixels in a way that maintains the interpretability and interactivity from the raw video footage. A game can be clearly reconstructed using dots plotted on a diagram of the field to illustrate how each possession happened without the need of the extra detail available in the video footage in the form of millions of pixels.

The way the conversion from pixels to dots occur is via supervised learning, where the computer learns through machine learning processes to map and predict the input data from the pixels to the desired output of the dots. A number of computer vision techniques can be applied to achieve this goal.

Mapping Dots to Events

Once the dots (coordinates) have been generated from the pixel data of the video, the trajectories (movements) of these dots over specific timeframes can be mapped to particular events. For example, in basketball, you can start mapping these dots in the tracking data to particular basketball-related events that describe how certain outcomes occur in terms of tactical themes, such as pick and roll, type of coverages on pick and roll, did the player do a drive or a post up, off-ball screens, hand off, close out, etc. The dot trajectories are mapped to the semantics of a basketball play, and the players involved in that play, using a machine learning model that does that transformation using pre-labelled data.

Mapping Events to Expected Metrics

Expected metrics explain the quality of execution of certain events. The labels assigned to certain events are often not informative enough to explain that event. Instead, expected metrics transform an outcome label of 0 or 1 (goal or no goal) to a probability of 0 to 100% using machine learning. For example, a shot that goes in goal is considered 100% effective. However, a shot attempt that hits the post might be considered 70% effective, even if it did not end up in a goal. Regardless of the final outcome of that event, expected metrics help to evaluate whether an event was more likely to be 0% (unsuccessful), 100% (successful) or somewhere in the middle (ie. 55% successful). This concept of expected metrics is the basis of the Expected Goals (xG) metric in football. Expected Goals can also be extended to passes to calculate the likelihood of a pass reaching a certain teammate on the pitch.

Expected metrics provide an additional degree of context to each situation. For example, in basketball they use Expected Field Goal percentage (EFG) to explain that if a player misses a 3-point shot, rather than simply classify that player as missing a shot we can assess what is the likelihood that an average league player would have scored that shot from a similar situation. This can provide a measure of talent of a player over the league average and better contextualise his performance.

Limitations of Event and Expected Metrics Data

The main limitation of solely using pre-labelled event and expected metrics data using this supervised machine learning process is that not everything can be digitised. Most analysis conducted today are based on events and expected metrics, but these are semantic layers that have been pre-described or pre-categorised by humans. We have put certain patterns of play or combination of player movements into labelled boxes to make it easy to aggregate and analyse sport events. However, the dots generated from tracking data and their identified trajectories open numerous possibilities to perform further analysis that humans can’t do manually by ignoring these pre-labelled categories of patterns of play or specific player movements.

Performing Deeper Sports Analysis

The more granular the data the better analysis we can conduct of a sport. Tracking data provides that necessary level of granularity to conduct advanced analytics. Some of the key tasks that deeper data and better metrics can do much better than humans is strategy, search and simulation.

Strategy Analysis

Marcelo Bielsa once broke down the way he does analysis at Leeds United. His analysis team watches all 51 matches of their upcoming opponent from the current and prior seasons, each game taking 4 hours to analyse. In that analysis, they look for specific information about the team’s starting XI, the tactical system and formations and the strategic decisions that they make on set pieces. However, it can be argued that this methodology is time-consuming, subjective and often inaccurate. This is where technology can come in and help by making the analysis process more efficient than having a team of Performance Analysts spend 200 hours assessing the next opponent.

The idea is to transition strategy analysis in sports from a traditional qualitative approach to a more quantitative method. Tracking data has hidden structures. The strategies and formations of a team in a match of football is hidden within all the data points collected from tracking data. Insights on things like formation or team structures do not directly emerge from the tracking data without additional work on the data. This is because tracking data is noisy, for reasons such as that players are constantly switching positions on the pitch. But what tracking data allows you to do is to find that hidden behaviour and structure of a team or players and let it emerge.

Visual representation of a noisy tracking dataset of players in a football pitch (Source: Patrick Lucey at Stats Perform)

Visual representation of a noisy tracking dataset of players in a football pitch (Source: Patrick Lucey at Stats Perform)

As a way to better visualise and interpret tracking data, Stats Perform have developed the software solution Stats Edge Analysis to enable the querying of infinite formations based on tracking data. The software shows the average formation of players throughout a match, how often each player is in a certain situation, how a team’s structure evolve when they are attacking or defending or how does the formation compare in different context, situations or playing styles.

Formation analysis in Stats Edge Analysis software (Source: Patrick Lucey at Stats Perform)

Formation analysis in Stats Edge Analysis software (Source: Patrick Lucey at Stats Perform)

Search Analysis

How do we find similar plays in sport? How do we search across the history of a sport to find similar situations to the one we are interested in comparing with? One way is to use sport semantics and search using keywords such as a “3pt shot” play in basketball, a “pick and pop” play or a play “on top of the 3pt line”. However, if we want to know where all the players were located in a play, their velocity or their acceleration, as well as all the events that led up to that point, we would need to use too many words to describe that particular play very precisely. In other words, searching across the history of a sport for a similar play using just keywords does not capture the fine-grained location and motions of players and ball and does not provide a ranking of how similar the found plays are to the original play we want to compare them with.

A solution to this problem is to use tracking data. Tracking data is a low dimensional representation of what we see in video. Therefore, instead of using keywords to find a similar play, we could use a snapshot of a play using tracking data as the input in a visual search query. Users could then interact with a visual search query where they describe the type of play they want to search for and the query tool would then output a set of similar plays ranked by the degree of similarity to the play being queried.

Visual search query of similar plays (Source: Patrick Lucey at Stats Perform)

Visual search query of similar plays (Source: Patrick Lucey at Stats Perform)

This type of visual search tool based on tracking data can offer the possibility of drawing out the play to search for. It can also offer the ability to move players around the court and use expected metrics to show the likelihood of a player scoring from various positions. It can even show the changes in scoring likelihood based on the position of the defensive players relative to the player with the ball.

Play Simulation

Technology in sports is entering the sidelines. The type of technology coaches need to evaluate plays during a game and simulate different outcomes needs to be highly interactive. One way Stats Perform has used tracking data to improve play simulations is through ghosting. The idea of ghosting is to show the average play movements at the same time as the live play represented with dots on a diagram of the field. For example, tracking data can display the home team in one colour (blue) and away team in another colour (red), but additionally it can add a third defensive team in a different colour (white) that represents how the average team in the league would defend that same situation.

Ghosting of an average team in the league (white) defending a situation (Source: Patrick Lucey at Stats Perform)

Ghosting of an average team in the league (white) defending a situation (Source: Patrick Lucey at Stats Perform)

Another way Stats Perform is working with coaches in the sidelines to provide more interactive play simulations is through real-time interactive play sketching. A coach can draw out a play that they want their players to perform on their clipboard and what tracking data and technology can do is to make intelligent clipboards that can simulate how that play drawn by the coach would play out.

Performing Deeper Sports Forecasting

The more granular data available the better we can predict sports performance. Some of the applications of tracking data in forecasting include player recruitment (i.e. which players to buy, trade, draft or offer longer contracts) and match predictions (i.e. accurately predict the final outcome, score and statistics of a match both before the match takes place and in-play).

Player Recruitment

In the NBA, the league has a good level of coverage for tracking data. But what happens when a team wants to recruit someone from college? Tracking data might not exists in college leagues, which forces teams to use a very simplified version of reporting to forecast how that player is going to play once he is recruited onto the team.

This highlights the issue of tracking data coverage. Major leagues have that level of detailed tracking data, but most lower leagues and academy competitions do not. Also, historical matches from major leagues and sports prior to the era of tracking data will not have had the systems and equipment in place at the time to produce highly detailed tracking data. This is where the generation of tracking data through broadcasted video footage can fill that void.

Tracking data using broadcasting footage is the ultimate method to produce detailed recruitment data. Analysts can go back in time and produce data from all the previously untracked players by simply using the footage available from past games. Stats Perform achieves this through AutoStats. AutoStats is a data capture system that can identify where players are located even though the camera is constantly moving by applying continuous camera calibration. It detects body pose of players and can re-identify a player once that player comes back into view after having left the frame. Additionally, AutoStats uses optical character recognition to collect the game and shot clock on every frame, as well as using action recognition to track the duration of player events at a frame-level.

Once that tracking data has been generated from lower leagues or college games, AI-based forecasting can be applied to discover which other professional players is the scouted player of interest most similar to. These solutions can even project a young player’s future career performance. It can use prediction models from historical data of former rookies and their eventual successes to forecast future performances of current prospects.

Given the limited coverage of tracking data in lower and junior leagues, another method to overcome that limitation is to use the already collected event data to maximise the value of the coverage in event data compared to tracking data. Machine learning can define the specific attributes of two players to then compare them with each other. These attributes can be spacial attributes, such as where they normally receive the ball, contextual attributes, such as their team’s playing style (i.e. frequency of counter attacks, high press, crossings, direct plays, build up plays, etc.) and quality attributes, such as expected metrics to capture the value and talent of each player. This method can provide a clear comparison of two different players relative to the context in which they play in. For example, how often is a player involved relative to the playing style of a particular situation.

Taking all this data and the derived attributes from event data, you can then run unsupervised models, such as Gaussian mixture model clustering, to discover groupings of players based on their similarities, and then create a number of unique player clusters that divide pools of players. These clusters can then surface information about the roles that different groups of players play in their teams, whether they are “zone-movers”, “playmakers”, “risk-takers”, “facilitators”, “conductors”, “ball-carriers” or any other clusters that can emerge from applying unsupervised methods. This way, if a team wants to find a player similar to a specific successful player (i.e. players similar to Messi), but with some attributes that are slightly different (i.e. age, league, etc.), they are able to specify that search criteria and find players that fit the profile that they are after.

Sports Performance Analysis - AI in Sports 7.png

Match Predictions

There are a couple of ways that AI can help in match predictions. One of them is implicitly through crowd-sourced data. Prediction markets like betting exchange facilitate a marketplace for customers to bet on the outcome of discrete events. It is a crowd-sourced method, and if there are enough participants to represent the entire collective wisdom of the market, with enough diversity of information and independence of decisions in a decentralised way, it is the best predictor you can get. It is an implicit market as we do not know the reason why people have made their betting choices, therefore it is not interpretable. If enough people are participating in these markets, then all possible information to make a prediction is present in that market. If that is the case, it is not possible to beat the accuracy of that market prediction.

Another method is to use an explicit data-driven approach using only data from historical matches together with machine learning techniques to predict probabilities of match outcomes. This method relies on the accuracy and depth of the data available and can only capture the performance present within the data points collected. The advantage of using a data-driven approach is that it can be interactive and interpretable. Also, it only needs the data feed of events, which makes it scalable. However, since not all data might be captured in the dataset used (i.e. injury data), there may be gaps in the analysis that can affect the predictions made.

Sportsbooks normally use a hybrid approach of crowd-sourced data together with data-driven methods to balance the action on both sides of the wager and also to manage their level of risk. They initialise the market with a data-driven approach and human intuition and then iterate based on volume, other sportbooks line and any unique incentive they want to offer to their own customers.

AI-based solutions and tracking data can be used to support these prediction markets, particularly in those markets with insufficient coverage to achieve crowd wisdom. One way of doing so is through the calculation of win probability. Win probability is extensively used across nearly every sport for media purposes. The current limitation of win probability is that it is based on the likelihood that an average team would win given a particular match situation. However, simply using an average may miss contextual information about the specific strengths of particular teams or players involved. The way to overcome that is to use specific models that incorporate the players, teams and line-ups of the match in question.

Stats Perform uses models that learn compact representations with features such as the specific opponent, players involved and other raw features describing the lineup to improve prediction performance based on the players involved in the game. This allows them to create specific player props that can predict individual player statistics (i.e. expected points scored in basketball) for each player in the lineup and illustrate that player’s future game performance before the game starts.

Sports Performance Analysis - AI in Sports 14.png

Similarly, these predictions can also be made in real-time while a match is being played. For example, using tracking data, in-play predictions in a tennis match can predict who is more likely to win the next point while the rally is taking place. You can even go a level deeper and predict what is the location where the ball will land after the next strike. In football, you could also predict who is the next player who is going to receive a the ball from a pass or where the next shot on goal is going to occur. This is the true value of highly granular levels of data and a data-driven approach to sports analysis.

Interview with Tom Johnson, First Team Analyst at Crystal Palace FC

Tom Johnson is currently the First Team Performance Analyst at Crystal Palace FC. He joined the club 4 years ago as the Head of Academy Performance Analysis, having previously been a Senior Academy Analyst at Derby County FC, where he started his career as an intern. Apart from being an analyst, he is also an under 13s coach. Tom tells us all about his journey in Performance Analysis and what it is like to work in a Premier League club.

Sports Performance Analysis - Tom Johnson Crystal Palace.png

Tell us about your background. What made you want to become a Performance Analyst?

It originally started when I was at college. I had finished school and always had an interest in football. I played recreationally but was never at that level to make it as a professional, which I had already realised when I was a child. But I always wanted to stay in football, I love watching football, love being part of football, so I decided to make the decision to study Sports Science and coach at a higher level other than just part taking.

When I was 16 or 17, I decided to enroll in a course at a local college, where I grew up in Essex, to study Sports Science and Coaching. In that time, I started coaching part-time at a grassroots club helping with the development centre in a local team Southend United. There I was getting some experience as a grassroots coach to try to learn the craft. I was then able to get into university. I enrolled in a course at Nottingham Trent University to study Coaching and Sports Science with a view to get down the coaching pathway. At this point, I had already completed my Level 1 and 2, which was the aim, and then to get my UEFA B as soon as possible.

It was whilst at uni that I was introduced to Performance Analysis. This was in about 2012 or 2013, when Performance Analysis wasn’t anything new back then. However, the publicity that it has nowadays, with the online community and how much more you hear about it now, wasn’t prevalent at the time. My first introduction to Performance Analysis was through a lecture at university, where a member of staff at Derby County talked about an opportunity that they had at their club to come in and learn and get some experience on Performance Analysis. The opportunity meant filming and analysing the academy games at the club. When the Derby County staff member spoke at the lecture about looking at football from a tactical side of things, working with coaches, working with players, it ticked the boxes in my head as that was the side of coaching I loved doing - speaking with players, talking about the game, etc - not so much on-field coaching but more like off-field coaching. I was intrigued about what it could be like so I applied to the internship. The word “internship” sometimes has negative connotations. It was more of a studentship really. It was part of my course as I was using the hours I was doing at Derby County to put towards my work-based learning.

Long story short, I gained 18 months experience from halfway through my 2nd year of university all the way through my third year. I was volunteering my time at the weekends, mainly Saturdays and Sundays. One day of the week I would also go along to the academy and learn the job. That is how it all started. At the end of my internship, I was in a really lucky position that after 18 months of volunteering, Derby’s academy went from Category 2 to Category 1, which actually meant that there was a position available in the analysis department in the academy to become full-time. I applied for the role and was able to get it.

So, really, my journey to become an analyst was pretty smooth. I was volunteering my time and showing my skills and ability on the job to eventually be able to get it. When I talk to people I say it is like an 18 month interview. The internship and the volunteering at Derby was all about meeting the coaches, getting that relationship with them, with the academy manager, with the analysis staff so that when it came to my interview I knew the guys interviewing me anyway, which was really fortunate.

How did your current role come about?

Essentially, I spent my first full-time role at Derby working with younger age groups. I had already being doing that as an intern, so the transition into start working with coaches in the foundation phase (9s to 12s year-olds) and the youth development phase (up to under 16s) was smooth. The actual analysis that was taking place at the time was quite broad. You worked across lots of age groups so you couldn’t really go into too much detail. You could go into detail but obviously not as much as you would go if you worked with just one team. It is about giving the players, especially younger players, an introduction into analysis and what it is like to watch yourself back. In academy football, they put a lot of pressure on young players to succeed, so hopefully through the use of analysis we were able to give them a football education outside of the football pitch. We had a day release program whereby the lads would come in and train in the morning but in-between sessions we would put on some analysis and hold educational sessions working on the development of individuals, getting them to set their own development tasks. That was mainly my role with under 16s age groups.

After 2 seasons, I moved up to work purely with under 18s age groups. This role is a little bit different because now you are working with an emphasis on the Saturday game, doing things like building up the opposition analysis. It looks a little more like what analysis is like in a first team level, but you still have a massive emphasis on developing the individual players. As much as you want to win games, the aim is to develop the individuals in the team to hopefully help them become professionals and play in the first team. I really enjoyed that role, working with some great coaches. For example, Justin Walker, who is now one of the first team coaches at Derby, and Rory Delap, who is also an ex-Premier League footballer. I worked with lots of them whilst they were starting or in the middle of their coaching journey. We were all on a similar position, they were developing their skills as coaches and I was developing my skills as an analyst.

We also had a really good analysis department at Derby working under Steve Doyle, who is now working for Rangers FC. At the time when I eventually moved on, we had a department of about 4 to 5 full-time members of staff alongside about 6 to 7 students who came in and supported the department. I was loving working with Derby County and loved the work we were doing. We worked very closely with the first team staff, so I learned a lot and was able to bounce ideas off them. It was a great environment to work in. We shared a big office so we could constantly ask questions and bounce ideas off each other.

However, it came to a point when I was looking to progress professionally in my role. I felt that at the time my boss at Derby was comfortable in his role so I couldn’t move up within the club, so I had to look elsewhere. I grew up in the south of England, in Essex, in and around London, and an opportunity came up to work at Crystal Palace as the Head of Academy Analysis. The role meant working with the under 23s age group while also working as the Head of Analysis for the academy. This meant having a more managerial role that looked after the full-time staff and students at the club. Also, at the time, Crystal Palace were a Category 2 academy, so they were below Derby in terms of academy level. But in terms of players that they had at their disposal, South London is a hotbed for talent. I didn’t really notice the difference with Derby. If anything, the players that we were developing and were coming through the system at the time were at a higher standard at Crystal Palace.

My move to Crystal Palace was 4 years ago now, at the start of 2017. During that time, I was able to build the department which at the start was just myself and another colleague as the only full-time analysts. Crystal Palace’s academy were also going through a big push to try to get to Category 1, and I already had that experience of transitioning from Category 2 to Category 1 at Derby, which meant I was able to use my experiences. Together with the other coaches and members of staff at the academy at Palace we had a really good working environment to really push the academy along.

Sports Performance Analysis - Tom Crystal Palace 9.png

During the two years I worked in the academy at Crystal Palace I worked with some really good coaches with the under 23s, some of them really experienced ex-players and coaches. For example, Dave Reddington, who I am working with now in the first team, or Richard Shaw, who is now working with Watford. It is really important as an analyst to work and bounce ideas off ex-players and current coaches because that is where you really develop as an analyst. You can learn so much out of a textbook, filming and watching games, but getting that experience when talking to coaches, what they are thinking of, you start gauging where they are at in terms of tactical side of things. It is always interesting to get their ideas and their views on things.

I worked on that role for 2 years and in that time was able to develop the department as well as my role with the under 23s. In terms of how I got into my current role, the first team analysts at the time Charlie Radmore got the opportunity to go work for West Ham so he transitioned from club to club. There was then an opportunity for me. My current boss Ben Stevens asked me to move up and work with the first team. I got a call from the Sporting Director and Ben and they said that they were looking to bring me up to promote within, so I grabbed it with both hands.

I suppose that the end goal at the start of my career was to work in a first team environment, to hopefully work in the Premier League, which I think is one of, if not the best league in the world, and use all my experiences in the last 5 to 6 years to analyse games in the Premier League. I’ve now been in this role for 2 years. It was a big step up for me in terms of the intensity of the work and the pressure that the first team environment brings. Even with the under 23s age group you are looking to develop individuals. No matter if you win, lose or draw in the game day you are still trying to look at the individual performance and the development of the players. But now when you lose or draw a game on a Saturday it means a lot compared to that. There is more focus on the team performance and what that brings.

That is a whistle-stop tour on where I am now. I suppose that when I speak to other people about it now it sounds like a smooth transition. I’ve been very fortunate to be in the position I am now, but without lots of hours of volunteering initially to get to that position where I am now it wouldn’t have been possible. As lucky as I’ve been to be at the right place at the right time, you need to take some risks. If you want to succeed in anything you need to take a bit of risk. My risk was to move to Crystal Palace out of the comfort of that role I had at Derby Country. I thought “ok, I’m going to do this”. I trusted myself to be able to do it and was lucky enough to succeed at it. 

What is the main highlight in your analyst career?

If you talk to a player or a coach they will always say that their main highlight is winning a trophy or a certain game that sticks out. For me, the highlight of my career is obtaining the job I’ve got today. It doesn’t happen overnight. Winning a game of football, or if you are lucky enough to win a league, cup or trophy is such a big thing and could definitely be a highlight, but it has so many different variables that go into it. For me, to be able to do the job I’m doing now is the highlight of my career.

I enjoy working with the elite coaches and players. I’ve come from first starting to work with players under 9 and under 10, and while that is enjoyable it seemed so far away from the top, a little detached. That’s not to say that those young players are not going to go on and be professional. So many of the young players I’ve worked with are now playing at a senior level, which is a massive highlight for any analyst or coach working in grassroots or even academy level. The highlight is seeing them 4 or 5 years on making their first team debut and playing in the Premier League. That was definitely the highlight of when I was working in academy football, seeing players flourish and develop. However, by no means I’m saying that I had a hand on what they’ve done, they’ve done it for themselves, but you feel part of the process. As an analyst, you are a small part of that process and it’s great to see these players flourish and kick on. It’s a holistic process and you can’t pin it down to one person that has made that player’s career possible, but I feel that as a whole you are part of that process.

At Derby County I was very lucky. In the current first team squad they’ve got probably 7 or 8 players that were in the under 15s, under 16s and under 18s at the time when I was there. They’ve had an amazing list over the last couple of years. They’ve really pushed lots of young players through. For example, Jayden Bogle and Max Lowe have gone on to play for Sheffield United. Derby currently has got Jason Knight who was also only 15 when he came over from Ireland when I first started working there. There is also Max Bird. Also young players like Kaide Gordon who has just left Derby and gone to Liverpool. It is a real big pool of players that Derby are pushing through, which is excellent to see. I speak to some of my ex-colleagues now and they are saying that the talent they had in across those age groups is second to none. It is great to see. You see all these players and remember watching them when they were 12 years old. That is probably the biggest highlight having worked with younger players.

At Crystal Palace now, I’ve been lucky that when I first joined the club Aaron Wan-Bissaka was already playing in the under 23s. He had just transitioned to start playing right back. When I joined 4 years ago they had just had a discussion that he had been a wider player, a winger, but that they should transition him to play right back. To be honest, I can’t say I had any impact at all, it was the coaches just before I arrived that made that move. Then for the first year working with the under 23s he was a great asset to have in that group. He was training with the first team most days and then the rest is history. He made his debut and never looked back and now he’s gone to Man Utd. Also, currently at Crystal Palace we’ve got Tyrick Mitchell who has come on to the first team at the end of last season / start of this year. He’s another full back who is doing very well. Similar story with Tyrick, he was on the under 18s when I first joined and it has been great to see his pathway come through.

These are players that when you work with them in a younger age group and you then see them come through you talk to them outside the game and see how they are getting on. No necessarily put a shoulder because the coaches and the rest of the staff do that, but you just have a conversation and see how they get on. I would say that the biggest aspect of the role having worked in the academy is seeing younger players come through, make their debuts and hopefully go on to have careers. There are plenty of other examples out there. I am currently working as a coach with the under 13s as well and we tell the players that the chances of you becoming a professional in the Premier League are so slim, but what we really are there for is to make these under 13s footballers, or whatever age group, better people outside of football. Hopefully we can do that. If they then get a career in the game that’s even better, but it’s making the person as much as making the footballer. It’s great to see that I’ve been part of so many success stories, and there are other success stories that have gone on to make it at other clubs, gone out on loan or maybe stepped out of academy football and play in non-league. I see those as much as a success as some of the top names I’ve mentioned before. 

What are the most challenging aspect of the role of an analyst?

Other analysts that I speak to and some good friends and ex-colleagues of mine who are now working in the Championship have ridiculous schedules of 46 games. For me, the biggest challenge I found from stepping from my previous role into this role working with the first team is the intensity of it. It’s almost like there are no days off. Not in terms of physical days off but almost that you are always watching, always focusing on the next game. One game is finished and you are onto the next one. The intensity can be quite stressful. You can’t have a day off or have a day when you are not on it because of the type of content that we are having to produce for the coaching staff and players, if you do you are going to get found out straightaway. For me, the most challenging aspect was that intensity and having to pretty much bring myself up to speed. To make sure to work and produce every single day and that the work is of certain acceptable standard that the coaching staff want.

I’ve been in my current role two years this month. I came into the role at the end of the 2018/19 season. There was a handover period with Charlie who later moved clubs but from the start of the 2019/20 season it became my first full season in the first team. I am always learning, that’s a given. You are always learning from other people. My colleague Rob Weaver has been working for the club for about 5 years, so when I first moved here I learned so much from him because he was so up to speed with the way coaches wanted to work. I think that is so important as an analyst. You almost have got to be their go-to person. They always come to you or you go to them. You have got to know what they are thinking before they are thinking it. Rob had all of that knowledge from the 3 years he had worked previously with the current staff before I joined the first team, so it was me bouncing off him and the coaches to get up to speed. I definitely feel I’ve progressed in the last two years, but there is no slowing down. You are constantly learning, taking different bits of information from them to develop yourself as a person and an analyst.

What are the most important skills for an analyst?

First and foremost is organisation. As an analyst you cannot do the job if you are disorganised. If you are not organised you can miss deadlines, and you can’t afford to do that unfortunately, it’s a simple as that. We are quite lucky in that in this job you know what you are working towards. You’ve got a game day, you know that the game is on a certain date, so you’ve got a timeframe to work towards. When you are playing every Saturday, the schedule can be quite simple. But when they chuck in a mid-week game, or when you’ve got the Christmas period, that always condenses the timeframe right down. Because of that, organisation is massive.

Communication in terms of speaking to people like the coaches and other colleagues is important. Constant communication, whether talking about the game or talking about the plan, is very important. I don’t think you could do the role if you are a poor communicator. You’ve got to get your ideas across. You’ve got to listen as well. Communicating is a big part of the role.

Sports Performance Analysis - Tom Crystal Palace 18.png

Finally, the ability to work under pressure. With the intensity of the role and the level of detail you are having to produce, the ability to work under pressure is massive at this level. Even with condensed schedules, expectations don’t change. We’ve just had the Christmas period and we’ve had the January fixtures as well. I am also hearing they are moving a fixture next week to compensate for the FA Cup. It doesn’t really slow down. Also, this year is unique in the sense that we missed a few weeks at the start of the season because of coronavirus. It’s a unique situation and because of that we’ve had so many games in such a short time. But the quality of the work cannot dip just because you’ve got two games in a week. It always has to be to the same standards.

What data and analysis do you use and how is it perceived at the club?

It is an interesting question because whoever you speak to will have so many different answers. Every single coaching staff and club have a different process in the way they perceive data and the way it is used in their processes each day. Currently, I’d say that my role, and it will likely stay like this, is video analyst. My colleagues and I work 90% of the time with video. That’s how the current staff want to work. They do not rely on the data, which is not to say we don’t use it. We currently use more video and really just back up what we are saying with the data. We won’t necessarily go to the data first and come up with our game plan or analysis off that. We would do the video side first and if there is any data that backs up what we are trying to say we would input it there.

Sports Performance Analysis - Tom Crystal Palace 10.png

That’s not to say we are neglecting it, we are very much in touch with what is going on with data analysis. At the club we have two Data Analysts that primarily work with the recruitment side of things. However, they also work alongside our team producing some of the data for the opposition reports we do. Any kind of bespoke analysis we need, whether is looking for a certain team and run some data on them that is outside of what we already collect on every team, then we would go to the Data Analysts for their expertise. At the moment, some of the algorithms and processes they use are way above my head but as an analyst I want to develop those skills over the next few years so that I can have a better understanding of how they get to their final conclusions. I understand the data once it’s given to us, but it’s the how they get there that is the interesting part for me.

In terms of how data is perceived at the club, like I mentioned, the current regime are heavily video based. You find that a lot of coaches and ex-players would always tend to gravitate towards video because that is what they know, it’s the game, it’s how it looks like. Some coaches you may hear them talk about data in the press conferences and in public, but our current regime is heavily video based. This suits the way Rob and I work at the minute, but if we had to use data more, if that come into our workflow, we are ready to incorporate it.

What are the main tools and technologies that you use in your analysis?

In terms of the technologies we use, Hudl SportsCode is my best friend. There is not a day that it is not open on my laptop. We are heavy users of the Hudl umbrella of companies. We use Hudl SportsCode, Hudl Replay as the technology on a match day when we send the stream down to the bench, and the Hudl online platform to share clips with the coaches and players. We heavily use Hudl platforms and systems every day.

Sports Performance Analysis - Tom Crystal Palace 13.png

The illustration tool that we use at the club is CoachPaint, which is a big part of our workflow. Once we have decided the clips that we want to show to coaches and players we then paint the story and put any kind of detail onto the clips with CoachPaint. Also on our day to day we use Keynote to produce presentations and dossiers because we work on Macbook applications to produce our work. We use Apple products to do that rather than PowerPoint and Word.

We also use other platforms to get our footage. We use DVMS, which is the sharing platform for the Premier League. The Premier League provides us with the footage of each game. Once you are a Premier League club you get access to every single game in the Premier League from 8 different angles. We also use Wyscout for video footage, mainly for anything outside the Premier League that we need to collect.

In terms of data, we also have access to Opta. We use their different platforms, like the query tool or the portal. We are able to get all our data that we need from Opta. Also, Scout7 is also used quite a lot as well, which is part of Opta. That is more for our scouting systems and to do reports on players or if we ever need to read up on players that we have not seen before. For example, a new signing from abroad. We use all of these different types of platforms to come up with the final product for coaches and the staff.

What does the future of Performance Analysis look like?

Analysis has come a long way from when I first started. For instance, things like SportsCode or the ability to have an iPad on the bench was unheard of before. You would always have to do stuff post-match and now so much analysis is done live. Where do I see it going? I definitely see that as a profession you will have a lot more coach-analysts. It is not something that is not out there already. In a lot of clubs you have coaches that are watching a lot more video and you’ve got coaches that are doing the analysis themselves. Coaching staff are coming with manager, assistant manager and first team coaches who are essentially analysts that also coach on the grass. I think there is definitely a shift in the role of the analyst.

Where I see the processes going? I suppose AI is being spoken about in terms of the coding process. There will be less emphasis on having to watch games and sit there picking through what things you are looking for. If you are looking for certain trends in the game you will be able to use the data and AI to do that for you. Still, I don’t know where I sit with that. Of course, having an analyst sitting there and watching the game is important. I will still go back to the eye and always want to watch it for myself, but we’ll see. Things have accelerated so much in the last 10 years, it’s been amazing. In 5 years time we might go back and think “remember what I was doing in 2021?”. I feel that’s constantly what we are doing. It’s exciting but it’s also difficult to keep up with technology at times. Keeping the finger on the pulse is difficult, but it will continue to develop as long as the game is being player at top level.

Sports Performance Analysis - Tom Crystal Palace 16.png

Another aspect is that when you go back 2 or 3 years you had Hudl, SportsCode and Nacsport, or other kinds of secondary platforms, but now you’ve got more and more technology companies trying to push different technologies and platforms to compete with these. It’s a good and healthy thing not to have companies monopolising the industry and the more options we have to go off the better.

What advice would you give to someone looking to get into Performance Analysis?

I’ve got many people asking me whether I’ve got any opportunities. It is difficult to get that first foot in the door, but there are also many things that as an aspiring analyst you can do to get into the industry. First and foremost, it is important to invest your time. That may be going out and volunteering at your local club. To become an analyst you don’t have to be working at a Premier League club, or even at a football league club in this country. You can go and work at your local grassroots team as an analyst. You also don’t need Hudl SportsCode to be an analyst. You can literally go back to basics and get a notepad and a pen out and stand at the side of the pitch and provide some sort of analysis. Now, obviously if you wanted to work at a club level and a professional level you are going to have to learn the technology at some point, but getting that kind of experience at grassroots or even academy level, if you have the opportunity at your local club, is invaluable.

Sports Performance Analysis - Tom Crystal Palace 15.png

I’ve also talked about communication and organisation skills. That’s where you learn that kind of thing, on the job, to then apply the experience later. Even though you might not be learning the technologies or intricacies of analysis, by working at a local club and with coaches, you are building the key foundations to become an analyst. Then, once you’ve got a foot on the door, say at a local academy side or with a college program that has funding and access to video cameras, you can start producing some video analysis.

I think it important to ask questions. You need to use your experience and your volunteering almost like a job interview. You use those to become full-time employed if that’s what you are aiming for, or part-time employed if that’s possible. Treat every experience you are doing as an opportunity to learn and develop yourself. For me, that is the most important advice. Not every opportunity you are going to get is going to be paid. See every opportunity like an internship, even if it’s not officially an internship or a studentship. Make some phone calls to your local grassroots club and say “can I come along with a camera?”. Nowadays, even an iPhone has the ability to film a game of football. You don’t need a top of the range camera. You probably just need an iPad or an iPhone if you’ve got one and start filming games and producing some sort of analysis to then build up from there.

Sports Performance Analysis - Tom Crystal Palace 14.png

I’ve been lucky enough to study at university. I did Coaching and Sports Science and then went on to do a Masters in Research in Performance Analysis. If I’m honest, I’d say you don’t need to be Masters degree educated to be an analyst. I know a lot of jobs say that they require an MSc or a BSc to do the role. I disagree with that in a way. They probably do it to vet the field of applicants. However, there are definitely examples of analysts out there that I know that haven’t had their education through university. They’ve come from a practical side of things, where they’ve been a coach and then gone on to become analysts. Don’t get me wrong, you probably need more experience to do it if you are not coming through university because university is where the opportunities open up to you, but don’t see it as a ‘be all or end all’.

Coaching certificates are also becoming more and more apparent. I am currently doing my UEFA B now. The reason I wanted to do that is that I have been coaching previously and I saw it as a bit of CPD for myself. I think they are definitely going down the route where analysts are going to be judged on their ability to deliver and coach off the field, so coaching badges can be important. Even by doing your Level 1 or Level 2 coaching badge that is definitely going to get you recognised within the football environment, as they can see you’ve got some sort of understanding of the game. Whereas if you have just done the academic route, people within football could question whether you have an understanding of the game. You might do and might be well educated in terms of football, but having both the academic and the coaching badges will always help.

Contextual Analysis In Sport Using Tracking Networks

Javier Martin Buldu is an expert on the analysis of non-linear systems and the understanding of how complex systems organise themselves, adapt and evolve. He focuses on the application of network science and complex systems theory in the analysis of sports. Buldu’s work is based on the principle that teams are far more than the simple aggregation of their individual players. By collaborating with organisations such as the Centre of Biomedical Technology in Madrid, La Liga, ESADE Business School, IFISC research institute and the ARAID Foundation, he has been able to combine elements of graph theory, non-linear dynamics, statistical physics, big data and neuroscience to construct various networks using positional tracking data of a football match. These networks are then able to explain what happens on the pitch beyond conventional ways of assessing the performance of individual players to understand team behaviours.

What Is Complex System Theory?

A complex system is a system composed by different parts that are connected and interact with one another. This system has properties and behaviours that cannot be explained by simply breaking down the system into its individual parts and analysing each individual part independently. For example, the human brain is a complex system and it has proven extremely challenging for scientists to fully understand how it performs all its functions, from how memory is stored to how cognition appears and disappears during certain illnesses. On the other hand, the human brain’s most fundamental component, the neuron, has been thoroughly studied and documented by science. Scientists have been able to recreate models and simulations of neuron behaviour, understand their shape and how they communicate with other neurons. However, this robust understanding of single neuron behaviour has not been sufficient to allow scientist to comprehend the interplay and interdependencies of the 80 billions neurons that form the human brain and that allows it to perform all of its complex behaviours. Instead, in order to appropriately study the brain, scientist need to pay attention to entire human cognitive system as a whole.

The idea behind complex systems like the human brain is what Buldu wanted to introduce in the analysis of football. While it is interesting to have information about isolated player performance, such as the number of shots, passes or successful dribbles, it is also important to understand the context in which these events take place. Additional insights on the performance of players and teams can be obtained by analysing information about how a player interacted with his teammates and the opposition’s players. Paying attention to individual player performances and aggregating those together is not enough to fully understand how a team behaves during a match.

Instead, a complex system approach to football analysis would, for example, look at the link created between two or more players when they pass the ball between them. A network of these players can then be created by simply leveraging event data collected from notational video analysis to count the number of passes from player A to player B and vice versa. These types of passing networks are increasingly common in football match analysis and team reports, as they clearly illustrate information about how a team played during a match, where its players were most frequently located on the pitch and how they interacted with each other.

Passing Network between FC Barcelona players (Source: Javier Martin Buldu at FC Barcelona Sports Tomorrow)

Passing Network between FC Barcelona players (Source: Javier Martin Buldu at FC Barcelona Sports Tomorrow)

However, more complex and informative networks can be developed by leveraging positional tracking data instead of event data. While event data is generated through notational analysis by tagging specific actions, positional tracking data instead describes the position of the 22 players and the ball on the pitch at any moment in time during a match of football. Unfortunately, positional tracking data is challenging to access for most analysts. That is why Buldu collaborated with La Liga to obtain a positional tracking dataset containing Spanish football league matches. To capture this information, La Liga uses Mediacoach, a software that acquires the positional coordinates of players and the ball using a TRACAB optical video tracking system that requires the installations of specialised cameras across the football stadiums. Mediacoach’s system allows them to track a player’s position at 25 frames per second and a precision of 10cm. Thanks to this detailed tracking dataset received from La Liga, Buldu was able to explore the different interactions between players to construct a number of complex tracking networks in football. 

Proximity Networks

The first network that Buldu produced explored the proximity between players on the pitch. He first calculated an arbitrary 360 degrees distance around a player, let’s say a 5m radius, and used it as a threshold to identify any other players that may fall inside that particular player’s area. If another player was located inside of the first player’s surrounding area, a link was then created between those two players. If those two players were from the same team, a positive link was created, while if they were from opposing teams a negative link was assigned to that interaction instead. By increasing or decreasing the radius of the distance surrounding each player (i.e. 5m, 10m or 15m radius), Buldu produced different networks and links between players following this method.

Proximity radius at 5m, 10m and 15m showing links with players of the same team (green) and with opposing players (red) (Source: Javier Martin Buldu at FC Barcelona Sports Tomorrow)

Proximity radius at 5m, 10m and 15m showing links with players of the same team (green) and with opposing players (red) (Source: Javier Martin Buldu at FC Barcelona Sports Tomorrow)

The challenge of producing a variety of proximity networks is that they may prove difficult to analyse, as the links identified in a single video frame using a 5m radius around each player may be very different to those found using a 15m radius. On top of that, the analysis should look at how those proximity networks evolve over a number of frames during the match. In order to gather practical insights from these networks, Buldu aimed to study the number of positive and negative links for each of the teams, as well as the organisation of the proximity network structure, its temporal evolution and how they change in relation to the zone of the pitch and the various phases of the game.

Proximity analysis of the 3-player links for all players in a match between Atletico Madrid and Real Valladolid (Source: Javier Martin Buldu at FC Barcelona Sports Tomorrow)

Proximity analysis of the 3-player links for all players in a match between Atletico Madrid and Real Valladolid (Source: Javier Martin Buldu at FC Barcelona Sports Tomorrow)

He first counted the number of links between three different players forming a triangle. He then classified each triangle into two categories: positive (all players from the same team) or mixed triangles (at least one player from the opposing team). Buldu was then able to determine which team had dominance over the other at different times of the match by then counting the number of positive triangles and the number of mixed triangles produced with a certain threshold distance. The team with the the highest proportion of positive triangles (i.e. all three players in close proximity to each other forming a triangle were from the same team) was deemed to have been dominant over its opposition.

Marking Networks

The second type of network that Buldu was able to construct with positional tracking data was the time a player was covering an opposing player during a defensive phase of play. Again, by setting an arbitrary threshold distance around a defender, a link between the defender and opposing player can be set by counting the time both players are in close proximity to one another. This process produces a matrix that illustrates the defenders on one of the axis and the attackers on the other axis, and provides a rough idea about the amount of time that each attacking player was being marked and by which defensive player. By interpreting the marking matrix analysts are able to identify the players with the highest accumulated time being marked by a defensive player.

Player marking matrix between Real Madrid (y-axis) and Leganes (x-axis) showing how often each Real Madrid players was marked by a Leganes player (Source: Javier Martin Buldu at FC Barcelona Sports Tomorrow)

Player marking matrix between Real Madrid (y-axis) and Leganes (x-axis) showing how often each Real Madrid players was marked by a Leganes player (Source: Javier Martin Buldu at FC Barcelona Sports Tomorrow)

Since matrices are the mathematical extraction of a network, this information can be drawn onto a diagram of a football pitch to plot the position of players during defensive actions. The size of each node in this network indicates the time an attacking player was being defended. By using these marking networks, analysts can clearly visualise the interactions and efforts of attacking and defending players during a match of football.

Player marking network between Real Madrid and Leganes (Source: Javier Martin Buldu at FC Barcelona Sports Tomorrow)

Player marking network between Real Madrid and Leganes (Source: Javier Martin Buldu at FC Barcelona Sports Tomorrow)

Coordination Networks

The third network that Buldu produced evaluated the coordination of movements between players of the same team. The network computed the velocity and direction of movement of two players to measure the alignment of their vectors. When this vector alignment was high, a high value link between these two players was created. When the alignment was low, a lower value connection was also derived from the two players’ movements. This method results in a matrix that illustrates how well players are coordinated with their own teammates. Two different matrices can be produced, one to analyse offensive phases of play and one for defensive phases.

Vector alignment of two attacking players (Source: Javier Martin Buldu at FC Barcelona Sports Tomorrow)

Vector alignment of two attacking players (Source: Javier Martin Buldu at FC Barcelona Sports Tomorrow)

Similarly to marking networks, coordination network matrices can also be translated into diagrams on a football pitch, where the nodes represent each player on the pitch while the size of each node indicates the amount of coordination the player has with the rest of his teammates. The links between two nodes also indicate the level of coordination between two particular players of the same team.

Movement coordination of each player with the rest of his teammates (Source: Javier Martin Buldu at FC Barcelona Sports Tomorrow)

Movement coordination of each player with the rest of his teammates (Source: Javier Martin Buldu at FC Barcelona Sports Tomorrow)

This type of analysis, especially when split between offensive and defensive players, can help analysts better understand the level of coordination between attack and defensive plays. For instance, an analyst or coach may want to see high degrees of coordination when the team defends as a block as well as how that coordination changes during the different phases of the game.

Ball Flow Networks

Lastly, the final network developed by Buldu focused on ball movement between different areas of the pitch. This network was produced by splitting the football pitch into different sections and counting the number of times the ball travelled from one section to another in order to create links between two different sections. This ball flow network can also be visualised on a diagram of a football pitch, with the nodes representing each section of the pitch and links indicating the number of times the ball moved from one section to the next. The size of these nodes indicate the amount of time the ball was being played inside that particular section of the pitch. By constructing an entire ball moving network during a match, analysts can then identify which are the most important sections of the pitch for their teams and assess how to exploit different sections in the opposition’s side in order to create dangerous opportunities.

Ball flow network for a match between FC Barcelona and Espanyol (Source: Javier Martin Buldu at FC Barcelona Sports Tomorrow)

Ball flow network for a match between FC Barcelona and Espanyol (Source: Javier Martin Buldu at FC Barcelona Sports Tomorrow)

Buldu’s work provides a great analytical framework to assess the complexities of sports in which a large diversity of factors can influence different outcomes of the game. It is crucial that when analysing a sport, all the available contextual information is analysed from various perspectives that can together provide a more complete evaluation of performance. Researchers, scientists and analysts are increasingly producing exciting work with positional tracking data that can open the door to new sophisticated methodologies and models to help coaches better understand the key influential factors of their team’s performance.

Further Reading:

  • Futbol y Redes Website

  • Buldu, J. M., Busquets, J., & Echegoyen, I. (2019). Defining a historic football team: Using Network Science to analyze Guardiola’s FC Barcelona. Scientific reports, 9(1), 1-14. Link to article.

  • Buldu, J. M., Busquets, J., Martínez, J. H., Herrera-Diestra, J. L., Echegoyen, I., Galeano, J., & Luque, J. (2018). Using network science to analyse football passing networks: Dynamics, space, time, and the multilayer nature of the game. Frontiers in psychology, 9, 1900. Link to article.

  • Garrido, D., Antequera, D. R., Busquets, J., Del Campo, R. L., Serra, R. R., Vielcazat, S. J., & Buldú, J. M. (2020). Consistency and identifiability of football teams: a network science perspective. Scientific reports, 10(1), 1-10. Link to article.

  • Herrera-Diestra, J. L., Echegoyen, I., Martínez, J. H., Garrido, D., Busquets, J., Io, F. S., & Buldú, J. M. (2020). Pitch networks reveal organizational and spatial patterns of Guardiola’s FC Barcelona. Chaos, Solitons & Fractals, 138, 109934. Link to article.

  • Martínez, J. H., Garrido, D., Herrera-Diestra, J. L., Busquets, J., Sevilla-Escoboza, R., & Buldú, J. M. (2020). Spatial and Temporal Entropies in the Spanish Football League: A Network Science Perspective. Entropy, 22(2), 172. Link to article.

Automating Data Collection And Match Analysis From Video Footage

Dr Manuel Stein has spent over 7 years researching and analysing player movement using detailed positional football data. His work has focused on the investigation of real-time skeleton extraction to perform match analysis of player movement with the aim of fostering the understanding of comparative and competitive behaviours in football. He has revolutionised the way match and tactical analysis is performed by teaching computers how to measure key playing aspects of the sport, such as team dominance or a player’s control of space derived directly from video footage. Stein has developed an automatic and dynamic model that takes into account the contextual factors that influence the movement and behaviour of players during a match. This novel player detection system automatically is able to display complex and advanced 5-D visualisations that are superimposed on original video footage.

Generating Data From Match Video Footage

The first step for any meaningful quantitative analysis is to obtain highly detailed data to properly test our assumptions. However, gathering highly detailed sport data may be challenging to obtain unless sophisticated tracking technology is used and the results of such tracking are easily accessible to the analyst. On top of that, when it comes to positional player data in football (i.e. xy coordinates of players on the pitch), gaining access to this level of granular data is especially challenging for most analysts. This is the same problem Stein faced during the initial phases of his research and that led him to develop a method for data extraction on his own using television footage and computer vision techniques.

Identifying Players On The Pitch

Stein’s method of extracting data from television footage started with the detection of each player on the pitch. In order to automatically identify the players, Stein addressed the unique colours that are present on the football pitch, more specifically the colours of the players’ shirts. By picking a player in the video, he constructed a colour histogram that best described the most prominent colours in that player’s shirt. Once those colours were identified, he then automatically searched across the video frame for contours of a minimum size that contained those same colours detected from that player’s shirt to spot all other players with the same colour shirt. The computer then automatically calculated the centroid of each detected area (i.e. the players as well as minor noise) and used the average measurements of human proportions to draw boxes enclosing the entire player on the screen.

Colour-based player detection (Source: Manuel Stein at FC Barcelona Sports Tomorrow)

Colour-based player detection (Source: Manuel Stein at FC Barcelona Sports Tomorrow)

This colour-based player detection method enabled Stein to identify all players on the pitch. The additional noise captured on the sidelines and stadium crowd was later removed by using threshold and ignoring areas that only appear on screen for a brief moment of time. However, this colour-based detection approach has certain limitations depending on the match footage. Lighting variations during matches that kick off under sunlight and finish around dusk do not impact colour perception in humans, but they do so for automatic colour-based player detection systems, as towards the end of the match computers will not be detecting the same colours as they did during kick off.

In order to solve this limitation and develop a system that works on all match conditions, Stein explored additional automated real-time methods to simultaneously extract player body poses and movement data directly from the video footage. One of those methods was the use of OpenPose, a well-known and established computer vision system for human body pose detection. However, OpenPose was not a suitable option when working with football footage, as the system struggles to detect small scaled people on the screen and is also unable to be computed in real-time during a match. Instead, Stein developed and trained his own deep learning model completely from scratch.

Body pose detection system (Source: Manuel Stein at FC Barcelona Sports Tomorrow)

Body pose detection system (Source: Manuel Stein at FC Barcelona Sports Tomorrow)

Stein’s human body detection model uses a skeleton model based on a hierarchical graph structure that represents a body’s pose. Every node on the hierarchical graph corresponds to the position of a body part from the person’s skeleton such as joints, ears, eyes and so on, called key points. The edges of this hierarchical graph represent an anatomical correct connection between two body parts. Stein’s body pose detection process followed two stages: the detection of individual body parts followed by the probabilistic reconstruction of the skeletons by connecting all identified body parts together. The constructed skeletons of the players were then overlayed on the original video footage for easy visualisation. Stein model’s estimation accuracy results outperformed those of OpenPose when estimating the skeletons on medium-scale people from the Microsoft COCO dataset. Moreover, their model architecture is also optimised for real-time and low latency video analysis, unlike OpenPose which struggles to run on resolutions of close to 4k.

Identifying The Ball

The next step was to detect the ball. For that, the model followed a two-step approach: a per-frame candidate detection step followed by a temporal integration phase. It first detected all possible objects on the screen that could potentially be the ball by using a convolutional neural network. The computer detected things such as the penalty spot, the corner kick spot, the centre spot, white football boots or the ball itself as being possible candidates. The next step was to identify an accurate and realistic ball trajectory over a period of time from the previously identified candidates using a recurrent neural network. This enabled the model to specify which one out of the previously detected objects was indeed the ball, as it was moving throughout the footage as a ball would be expected to move. By using this approach, the ball could be tracked even when it was not visible on the video footage. For instance, the computer continued to track the ball even when a player picked it up before a penalty kick and happened to hide it from the camera.

Determining Player And Ball Location On The Pitch

Once both players and the ball have been detected, the following step is to determine their location on the full football pitch. The challenging part in this section is the fact that the camera is continuously focusing on different parts of the pitch rather than the pitch as a whole. To solve this issue, Stein had to produce a static camera shot by creating a panoramic view of the complete stadium using a subset of input frames from the video footage (i.e. all frames from the first two minutes of a match). The overlap of all these snapshots from the video footage was then used to recreate a panoramic view of the pitch that allowed Stein to calculate the pitch’s homography. He was then able to identify how two different images connected together, or detect whether one image was simply a subset of a larger image. The homography calculation then enabled Stein to project each of the frames from the video footage into the panoramic view of the pitch as a unique reference frame and fully visualise where on the full pitch each frame took place.

Projection of frames on the panoramic view of the full pitch (Source: Manuel Stein at FC Barcelona Sports Tomorrow)

Projection of frames on the panoramic view of the full pitch (Source: Manuel Stein at FC Barcelona Sports Tomorrow)

With all players and the ball correctly identified and their position accurately projected on a panoramic view, the next step was to project these player locations into a normalised football pitch to start generating usable positional data for further analysis. By providing the system with a standard image of a football pitch, a user can select a minimum of four points both from the panoramic view and their image of the pitch in order for the system to use the homography calculations from the panoramic view and translate them into the standard image of the pitch. This allows the system to automatically plot accurate player positional data on a standard diagram of a football pitch.

Player locations and movements illustrated in real-time on a diagram of the pitch on the top right corner (Source: Manuel Stein at FC Barcelona Sports Tomorrow)

Player locations and movements illustrated in real-time on a diagram of the pitch on the top right corner (Source: Manuel Stein at FC Barcelona Sports Tomorrow)

Automatically Measuring Contextual Information From Video

Stein took his research further by incorporating the tracking of elements in a match that are not clearly visible to a computer, areas such as the dependencies, influences and interactions between players during the various scenarios of a game. For a fully automated football analysis system to work, this context information that is obvious to humans also needs to be taken into account and measured by the computer. In a dynamic team sport like football, players are more than simple and independently moving dots on a pitch. There is a complex network of interactions and dependencies that dictate how a player reacts to a situation, how they cooperate with teammates and how they attempt to prevent the opposing players’ actions.

Interaction Spaces

One way to automatically measure contextual information from player positional data was to identify the specific regions on the pitch that are controlled by the different players. Stein argued that each player has a surrounding area around them that he fully controls based on his position on the pitch. These control regions are what he called ‘interaction spaces’ on the pitch that a player can reach before any opposing player or the ball could reach that same space. The size and shape of these interaction spaces are influenced by player speeds and directions, as well as the distance between the players and the ball. This is because players further away from the ball may have more time to react.

Interaction spaces for each player (Source: Manuel Stein at FC Barcelona Sports Tomorrow)

Interaction spaces for each player (Source: Manuel Stein at FC Barcelona Sports Tomorrow)

On top of that, competition between two opposing players to control a certain zone has also an impact on the shape of these interaction spaces, as players from the opposing team will aim to restrict certain opposing player movements. Therefore, when defining interaction spaces on the football pitch, Stein aimed to consider these interdependencies that may restrict a player from reaching a particular zone before an opposing player to maintain ball possession. This can be seen in the above illustration between the blue team’s defensive line and the red team’s forwards, where players that are close to opposing players may restrict each other’s interaction spaces. Lastly, Stein was able to leverage the pitch visualisations of the previously recorded positional data and enrich it with additional context information that clearly illustrates each interaction space in real-time.

Free Spaces

An alternative way of contextualising automatic tracking data was the inclusion of free spaces. Stein calculated free spaces by segmenting the pitch into grid cells of 1 squared metre. He then assigned each respective cell to the player with the highest probability of reaching that cell in relation to the distance to the cell, their speed and direction of movement. Similarly to interaction spaces, free spaces where the cells from the grid that a player could reach before any other opposing player. Ultimately, free spaces represented the pitch regions a specific team or player owned.

All free spaces identified for a team in blue (Source: Manuel Stein at FC Barcelona Sports Tomorrow)

All free spaces identified for a team in blue (Source: Manuel Stein at FC Barcelona Sports Tomorrow)

To evaluate which free zones were more meaningful for analysing, Stein ranked all free spaces on the pitch by their value in relation to their respective sizes, number of opposing players overlapping such spaces and the distance to the opposing goal.

All high value free spaces shortlisted for a team in blue (Source: Manuel Stein at FC Barcelona Sports Tomorrow)

All high value free spaces shortlisted for a team in blue (Source: Manuel Stein at FC Barcelona Sports Tomorrow)

Dominant Regions

Stein expanded his concepts of region control on a football pitch by using similar calculations to those of interaction spaces to create a model that highlights the dominant regions for each team. These dominant regions are calculated by looking at areas on the pitch that can be reached by at least 3 players of the same team simultaneously. Ultimately, they represent the areas in which a particular team has substantially more control over the other.

Dominant zones by players in the blue team (Source: Manuel Stein at FC Barcelona Sports Tomorrow)

Dominant zones by players in the blue team (Source: Manuel Stein at FC Barcelona Sports Tomorrow)

Cover Shadows

Similarly, Stein extended the concept of interaction spaces to calculate player cover shadows, referring to the area a player can cover in relation to the position of the ball. In other words, a player has full control to prevent a ball from reaching their cover shadow region. Cover shadows can be thought of as a hypothetical light source coming from the ball at a 360 degree angle. These cover shadows represent the regions that the player is able to control before the ball gets to them.

Cover shadows illustrating a player’s area coverage in relation to the ball (Source: Manuel Stein at FC Barcelona Sports Tomorrow)

Cover shadows illustrating a player’s area coverage in relation to the ball (Source: Manuel Stein at FC Barcelona Sports Tomorrow)

Applications Of This Automated Player Tracking System

When looking at the possible applications of his automated tracking system, Stein had to consider the roles of Performance Analysts and the coaches. For a Performance Analyst, video and movement data are key when analysing the strengths and weaknesses of their team and the opposition. On one side, analysts have a window on their screens with their video analysis software opened, such as SportsCode or Dartfish, to notate events and analyse playing actions. While on the other side, they have another window with the original video footage of the match that they use to verify and interpret any observations captured from their coding. Often what this means is that the analyst is looking at two different windows and comparing them to one another. While this is common practice in the field of Performance Analysis, the exercise of switching focus between two screens may often prove to be an inefficient approach to video analysis. Focusing on two windows simultaneously can prove significantly challenging to the human eye, often leading to a ‘pause and play’ exercise during analysis.

Stein aimed to solve this problem by combining the benefits of the visualisation of the pitch from his new automatic player tracking system with the original match footage. By simply inverting the homography from the abstract pitch into the video footage, he was able to draw visualisations directly on the real pitch. This allowed him to illustrate in real-time different types of analysis, from evaluating offensive free spaces to looking at players’ interaction spaces.

Interaction spaces automatically displayed directly on real match footage (Source: Manuel Stein at FC Barcelona Sports Tomorrow)

Interaction spaces automatically displayed directly on real match footage (Source: Manuel Stein at FC Barcelona Sports Tomorrow)

Stein’s dynamic and automatic real-time visualisation offered a whole new range of design opportunities for match analysis in football. For instance, the system was able to change a player’s shirt colour based on their behaviour (i.e. based on fatigue). It was also able to illustrate the best passing options available to the player with the ball.

Automatically computed best passing options (Source: Manuel Stein at FC Barcelona Sports Tomorrow)

Automatically computed best passing options (Source: Manuel Stein at FC Barcelona Sports Tomorrow)

This novel tracking method provides an invaluable automatic measurement of the context of a match situation. However, similar to any other analytical tools, it needs to be correctly applied in order to make a difference to team and player performance. Aside from the clear operational efficiencies brought by the automation of tedious notational work, the benefits in knowledge acquired from this system needs to be appropriately incorporated into the analysis loop. For instance, data on free spaces can be used to automatically detect suboptimal movements from players and suggest potential improvements for such behaviours. For example, an analysts can select specific situations where there was a shot on goal or dangerous play by the opposition to then identify which of their own players had control over free spaces that could have prevented such occasion. Once a selection of possible players have been identified, analysts can assess which one of those players lost control of their space the fastest and how such player could have kept control over his opponent. The identified player can then receive information about which should have been his optimal position on the pitch and their control of field space in order to reduce the free spaces towards his own goal left to be exploited by their opponents. Stein’s system is able to provide this guidance to analysts, coaches and players by automatically calculating the player’s moving trajectory based on his speed and interactions space and suggest an optimal realistic movement for that player, from the starting position to the optimal point. This means that the system can automatically suggest improvements in collective behaviour based entirely on the contextual information being processed.

Click and drag interactivity (Source: Manuel Stein at FC Barcelona Sports Tomorrow)

Click and drag interactivity (Source: Manuel Stein at FC Barcelona Sports Tomorrow)

The system also offers interactivity, where analysts and coaches can drag and drop players around the pitch to explore the different control spaces the player would benefit from if they were in a different location of the pitch. By moving a player to a different location, the system automatically updates the player’s trajectory and interaction spaces relating to their new location and the other players around him. This gives coaches and analyst the possibility to interact with the analysis and to adapt the system based on their own acquired knowledge of the sport.

Automated systems such as the one developed by Manuel Stein are bringing exciting levels of innovation to the sport by directly integrating data and video together. Thanks to these systems, football experts, coaches and analysts become more aware of the power of analytics once they are shown the context of real world scenarios, which in turn leads to better analytical approaches being developed that are better incorporated into the daily realities of the roles of analysts and coaches. Ultimately, it reduces or completely removes numerous tedious and time consuming work performed by analysts today in a revolutionary way that frees up time away from simple data collection which can in turn be placed in more dedicated and advanced analysis of the sport.

Further Reading:

  • Manuel Stein’s publications

  • Stein, M., Janetzko, H., Breitkreutz, T., Seebacher, D., Schreck, T., Grossniklaus, M., Couzin, I. & Keim, D. A. (2016). Director's cut: Analysis and annotation of soccer matches. IEEE computer graphics and applications, 36(5), 50-60. Link to article

How The NFL Developed Expected Rushing Yards With The Big Data Bowl

Michael Lopez, the Director of Data and Analytics at the NFL, recently discussed at the FC Barcelona Sports Tomorrow conference the way that his Football Operations team and the wider NFL analytics teams leverage a large community of NFL data enthusiasts to obtain a better understanding of the game of American Football. In his talk, Michael walked through the journey that the NFL took to develop expected rushing yards, a concept that began as an initial idea within their Football Operations group and ended up making its way up to the NFL’s Next Gen Stats Group and the media.

What To Analyse With The Data Available In The NFL?

The first step that the NFL Football Operations team took to figure out what should be answered with the use of data is to try to understand what the general public thinks about when they watch an NFL game. To figure this out, they looked at a single example of a running play in a 2017 season game between Dallas and Kansas where the running back, Ezekiel ‘Zeke’ Elliot took 11 yards from a 3rd down and 1 yard-to-go. This run by Zeke Elliot eventually allowed Dallas to successfully move further down the field and score points.

Sports Performance Analysis - NFL Big Data Bowl.gif

Statisticians at the NFL then tried to understand what can be learned from a play like this one by breaking down the play to obtain as many insights on the teams involved, the offence, the defence, and even the ball carrier. An initial eye test by simply looking at the video footage told the analysts that in this particular play Zeke Elliot - the ball carrier - had a significant amount of space in front of him to pick up those 11 yards. But how could data be applied to this play to tell a similar story? To do so, NFL analysts first needed to take a look at the data and information that was being collected from that play, to understand what was available to them and the structure of the datasets that will allow them to come up with possible uses for that data.

There are three types of data being collected and used by the NFL analytics teams: play level data, event level data and tracking level data. Each one of these types of data present different levels of complexity, with some having been around for longer than others.

  • Play Data:  

    This data contains the largest amounts of historical records and includes variables like the down, distance, yard line, time on the clock, participating teams, number of time outs and more. It also includes some outcome variables like number of yards gained, passer rating to evaluate QBs, win probability and expected points. 

  • Event Data:

    This data is generated from notating video footage. It is usually performed by organisations such as Pro Football Focus or Sports Info Solutions by leveraging their football expertise. These companies tag events using video analysis software and collect data points such as the offensive formation, number of defenders in the box, defenders closer to the line of scrimmage, whether a cover scheme was man versus zone, the run play called and so on.

  • Tracking Data:

    This type of data refers to 2-D player location data that provides the xy coordinates as well as the speed and direction of players. It is usually captured at 10fps using radio frequency identification (RFID) chips located on each player’s shoulder pads as well as the ball. It tracks every player during every play of every game. This is the most novel type of data being collected by the NFL. Player tracking data was only started to be shared with teams from the 2016 season onwards.

2D Player Tracking Data (Source: Mike Lopez at FC Barcelona Sports Tomorrow)

2D Player Tracking Data (Source: Mike Lopez at FC Barcelona Sports Tomorrow)

The sample sizes of data that is available for NFL analysts to come up with new metrics varies for each one of these data types. When it comes to play data, there is an average of 155 plays per game, and 256 games played in a single season. This means that for the longest time in the sport, analysts have had a maximum of almost 40,000 plays per season to figure out the answers to NFL analytics questions. A similar scenario is true with event data, where the dataset available to NFL analysts will be a multiple of the number of observations you are producing through the notation of events from a maximum of 40,000 plays per season.

A very different scenario occurs with player tracking data, where the sample size is substantially larger. With 2-D player location of each player being tracked at 10fps on plays that usually last 7 seconds, the data collected jumped from those 155 observations (plays) per game in play-level data to between 200,000 and 300,000 observations for a single game for tracking-level data. This brought a more complex dataset to the sport and opened the door to new questions and metrics to be explored by NFL analysts.

Applying The Available Data To The Analysis Of The Game

There are various approaches that the NFL analyst could have taken to evaluate the running play by Dallas where Zeke Elliot gained 11 yards. Ultimately, they wanted to figure out what was the likelihood of Zeke Elliot picking up those 11 yards in that running play.

One of these approaches was to assign a value to the play to evaluate how the running back performed by using metrics like yards taken, win probability or expected points. By using this play level data, analysts would be merely calculating the probability of those 11 yards being achieved using simple descriptive metrics, such as the fact that it was a 3rd down and 1 yard-to-go in a certain location of the field during the first minutes of a scoreless match. If they then compared Zeke Elliot’s outcomes based on similar plays, all of these metrics would have shown positive values, as gaining yards would have had an increase in both the team’s win probability and expected points. Zeke Elliot’s 11 yard run may have well been above average when you describe plays using play level data. However, this approach would be missing the amount of credit that the running back, the offensive line and the offensive team should really receive from this outcome given the specific situation they faced.

Another approach was to leverage event level data to provide additional context of the play. This type of data could have helped understand Zeke Elliot’s performance by providing additional variables, such as the number of defenders in the box or the play options available, which would have allowed to compare the probability of taking 11 yards against other plays with similar characteristics. However, these approach may have also shown positive results due to the relative large yardage gain Zeke Elliot achieved for the run. Moreover, appropriately describing the situation only using event data may be challenging or inaccurate as it is conditioned to the video analyst’s level of football expertise and ability to define the different key elements of the play.

Instead, NFL analysts decided to make use of the 2D player tracking data for that play to come up with the spatial mapping on the field. By having a spatial mapping of the field, analysts could visualise the direction and speed in which each player was moving during the duration of the run, as well as what percentage of space on the field was owned by different players of each team. This gave analysts an idea of the areas that were owned by the offence and the ones owned by the defence, providing them with better understanding of the amount of space in front of the running back, Zeke Elliot, to take on extra yardage. The information obtained from the spatial mapping could then be used to calculate yardage probabilities given the extra condition of space to more accurately assess how well the offensive team performed.

Spatial Mapping of Zeke Elliot’s Run (Source: Mike Lopez at FC Barcelona Sports Tomorrow)

Spatial Mapping of Zeke Elliot’s Run (Source: Mike Lopez at FC Barcelona Sports Tomorrow)

In this diagram above, it is clear that the offense owned most of the space in front of Zeke Elliot, not only 11 yards ahead but even 15 yards in front of the running back, with defenders nowhere close to him. As oppose to evaluating the play with play or event level data, using tracking data raised further questions on the performance of Zeke Elliot on that play, as it may not be as positive as the other approaches may have suggested given the amount of space he had in front of him.

Following this example, NFL analysts next tried to answer the question of how to leverage player tracking data more widely to better understand what happens during plays. The NFL Football Operations analysis team wanted to learn more about how this data could be used to compare the performance of players given the positioning, direction and speed of all 23 players on the field. More specifically, it involved understanding the probability distribution of all possible yardage increments - i.e. the running back taking or losing 5, 10, 15, 20 yards and so on – to obtain a range of outcomes with their likelihoods that would then allow analysts to compare different performances in different plays. A probability distribution that is based on yardage increments could then be explored further to provide analysts additional insights on first down probability, touchdown probability or even probability of losing yardage on a given play in spatial mapping terms. Ultimately, this probability distribution could be turned into an expected yards metrics for running backs by multiplying each yard by the probability of reaching that yardage and summing up all the values together.

Leveraging AWS And The Wider NFL Community

The main goal of the NFL Football Operations team was to better understand player and team performance by leveraging the new xy spatial data from player tracking to come up with new metrics, such as expected yards, touchdown probability or run play. The NFL Football Operations team worked closely with the NFL’s Next Gen Stats Group to understand the value that such metric will provide to the sport and define a roadmap of how to go about developing such metrics. Sunday Night Football and other media broadcasters also showed a strong interest in using this new metrics to better evaluate performances on air.

In their first attempt at producing new metrics from player tracking data, NFL analysts partnered with data scientists from Amazon Web Services (AWS) to figure out how this large dataset of player tracking data could be used to come up with new football metrics. Unfortunately, after trying a wide set of tools, ranging from traditional statistical methods to gradient boosting and other machine learning techniques, the NFL Football Operations and AWS partnership never produced results that were satisfactory enough to be used by NFL Next Gen Stats Group or the media. While they learned about possible application of the spatial ownership distribution on the field, when it came down to validating the results against the one example of Zeke Elliot’s 11 yard running play, the results did not provide enough confidence to be used for the wider analysis of the sport. The AWS-NFL data science collaboration had reached a dead-end in their analysis.

In order to unblock this situation and produce a metric from tracking data that would match what was seen in the video footage, the NFL Football Operations team leveraged the crowd sourcing wisdom in football statistics through the Big Data Bowl, an event they organise since 2019 and that was also sponsored by AWS. The Big Data Bowl is an annual event that serves as a pipeline for NFL club hiring, as it helps identify qualified talent that can support the NFL’s Next Gen Stats domain in analysing player tracking data. Since player tracking data has not been around for a long time, this event enabled the NFL to understand what the right questions to ask from this data are and how to go about answering them. The Big Data Bowl also serves core NFL data analytics enthusiasts who want extra information on the sport by helping them understand more about the NFL through more intuitive metrics that more clearly reflect how fans think about the game. For the past couple of years, this event has also proven to be a great opportunity for NFL innovation, as it has successfully tapped into the global data science talent to solve problems that a team of data scientists at AWS and the NFL could not resolve on their own. The first Big Data Bowl in 2019 saw 1,800 people sign up to take part, with 100 final submissions from having completed the task given. Out of these pool of analysts and data scientists, 11 went on to be hired by NFL teams and vendors. The winner of the 2019 competition is now an analyst for the Cleveland Browns.

Source: NFL Football Operations

Source: NFL Football Operations

The success of the Big Data Bowl 2019 edition meant that the NFL Football Operations would decide to take advantage of the Big Data Bowl 2020 event to develop their highly anticipated expected yards metric from the 2D player tracking data. Instead of trying to figure out the metric internally on their own, they took a ‘the more the merrier’ approach to exploit the opportunities available from the analytics talent across the world. The NFL Football Operations team shared the exact player tracking data with the participants in the event, who were given the task of predicting where the running back would be after a handoff play, such as the one earlier discussed between Dallas and Kansas. By receiving this player tracking data, participants now had valuable data points specifying the positions of all the players on the field, their speed, the number of players in front of the running back, who those players were, and more. All they needed to do is to come up with a method that would allow the NFL to understand whether Zeke Elliot’s performance was above or below average.

The competition launched in October 2019, when data was shared and released by the NFL. There were a total of 2,190 submissions for the event, with participants from over 32 countries. The launch was followed by a 3-month model building phase to allow teams to develop their algorithms. These algorithms were later evaluated in real time during the 5-week model evaluation phase of the competition. This model evaluation phase tested each algorithm’s predictions using out-of-sample data and compared the results with the true outcomes. The competition used Kaggle as their main data science platform to encourage interactions and communication across teams through forums. It also provided a live leaderboard where teams could see how well their algorithms were performing against other teams. Team scores were completely automated based on how accurate the algorithms were against real data. The winning team was a team called ‘The Zoo’, formed by two Austrian data scientists, who came up with a 5 dimensional convolutional neural network containing only five inputs: the location of the defenders, the routed distance between defenders and the ball carrier, the routed speed of the defenders and ball carrier, the routed distance between all offensive players and all defensive players, and the routed speed of all offensive players and all defensive players. They eventually presented their model in the NFL Scouting Combine event that was attended by more than 225 teams and club officials. They also received a cash prize of $75,000.

The winning team’s model results significantly outperformed those of the rest of participants. The calibration of their model showed an almost perfectly calibrated model where their predicted number of yards closely matched the observed number of yards from an out of sample dataset. Their model was able to take data from a carry and predict the yardage that carry would achieve, not only for small gains of 3 to 5 yards but also for longer yard gains of 15 to 20 yards, which are rarer in the sport. Thanks to their model, an expected yards metric could be produced for every running play. This now provides a valuable tools to assess performance of running plays such as the one by Zeke Elliot. For example, when a player takes 29 yards from a run, if the model calculated an expected yardage gain of 25 yards for that run given the spacing the running back had at the handoff, that player should only get credited for having achieved 4 yards above the average. This new way for interpreting a 29 yards run would not have been possible unless a model successfully conditioned its probability calculation based on the space available to the running back to determine whether that player has performed above or below expectation.

Winning team’s calibration plot (Source: NFL Football Operations)

Winning team’s calibration plot (Source: NFL Football Operations)

The benefits of the Big Data Bowl format was that unlike hackathons, where participants may only get one or two weekends to produce something of value, this type of event enabled enough time for the teams to navigate the complex player tracking data set and come up with actionable insights. The NFL was then able to immediately obtain and share the new derive metrics with the media and their Next Gen Stats group to be used for their football analytics initiatives. Thanks to this approach, clubs can now better evaluate their running backs. Moreover, other industries, such as the growing betting industry in the USA may also benefit from the development of expected yards for their betting algorithms. Lastly, expected yards are now being widely used by NFL broadcaster to show whether running backs are performing well or not during the duration of a game. Metrics like this one would not have been possible without the NFL tapping to a global talent pool of data scientist to help them come up with this novel expected yards metric.

The NFL is continuing to run their Big Data Bowl this year, with their 2021 edition being a lot more open ended than previous editions. This time the task focuses on defensive play. They are sharing pass plays from the 2018 season and are asking participants to come up with a model that defines who are the best players in man coverage, zone coverage, how can the model identify whether the defence is man or zone, how to predict whether a defender will get a penalty and what types of skills are required to be a good defensive player. It leaves the interpretation and approach to the participants to define and allows them apply the right conditioning to the data provided. This approach of opening your data to the public in order to push data innovation forward has proven successful and would be interesting to see if other sports will adopt similar initiatives.

Communication With Coaches As A Performance Analyst

Performance Analysts are responsible for producing quantitative information that allows coaches to quickly identify areas requiring attention. This information is primarily delivered through the provision of objective statistical and visual feedback. It involves the selection of video clips that coaches can use to engage in detailed discussions with players, identifying performance areas that need improvement and making training decisions. Video feedback technology has become a major resource as more coaches now rely on video highlights as a guide to enhance training of their players. The introduction of technology in these informative and constructive interactions in recent years has made the role of the performance analysis field a critical part in coach-athlete communication.

Unlike in other sport science disciplines, the role of a Performance Analyst is extremely ingrained in the coaching process. Analysts have become the technology translators between coaches and players. They aim to provide coaches and players with an immediate performance advantage through the delivery of accessible video feedback and targeted data reporting. Inevitably, the success of the coaching feedback process in developing athletes and improving team performance heavily depends on the communication between coaches and analysts. In order for such delivery to be successful, it is important to understand the way coaches and analysts interact as well as create and maintain working relationships.

Why Do Coaches Need Analysts?

Analysts provide coaches with objective quantitative and qualitative information to fill in the gaps left by the natural limitations of human cognition. Studies have shown that elite coaches can only recall an average of 59% of critical events in a match when assessing their team’s performance (Laird and Waters in 2008). On top of that, their judgement may also be influenced by bias triggered by emotions that influence the accuracy of their evaluations and affect the extrinsic feedback they provide to their players. Performance Analysts attempt to solve for these qualitative and subjective observations made by coaches by complementing them with additional feedback based on a more systematic and objective analysis in the form of videos, images, quantitative and qualitative findings.

How Do Analysts Deliver Information?

Technology developments over recent years have brought new ways for analysts to communicate key performance insights to coaches in more graphical and visually impactful forms. However, the method used to deliver such information may vary with the context of the situation and the style of the coach at the club. A coach may change their coaching and leadership style between training sessions and competitive matches, ranging from a more democratic, person-centered approach to a more authoritarian or autocratic one. This coaching style may also be influenced by the type of sport, gender, age and level of the athletes. An analyst should carefully judge the preferences and character of the coach and the context of the situation in order to decide when, where and how to deliver the information to the coach. The system used should also be dictated by the information needs of the coach. In competitive sporting environments, most communication takes place verbally. Therefore, coach-analyst interactions usually take place by briefing the coach or face-to-face discussions in which verbal communication skills are key.

Some examples of delivery methods employed by analysts include:

Quantitative information (frequency counts)

An analyst’s main objective is to gather as much intel by observing, recording and analysing different events that take place on the playing field. This may include pre-match insights through objective performance profiling that expose the strengths and weaknesses or players and oppositions. This quantitative information, such as match statistics, may be presented as tables, charts or diagrams of the playing field, showing the location of events, while clearly indicating how the team is playing and highlighting areas where performance can be improved.

Qualitative information (context through video)

Video analysis packages are created to provide detailed qualitative information to coaches, where they can interactively view video highlights on specific areas of interest. By providing videos to coaches, analysts ensure that the context lost from simple frequency counts can be recovered. With this additional context from the video replays, coaches can have a more in-depth evaluation of performance issues, understand why certain problems occurred and make adjustments to enhance future performance. During the delivery of these video highlights, analysts may want to point out specific features that they want coaches to notice to prevent overwhelming them with too much information and keep them focused on the most relevant points. Once a coach is able to gather enough information from both quantitative and qualitative information, they may want the analyst to produce a video package with a shortlist of selected clips to use in discussions with players.

Sport Performance Analysis - Communication with Coaches 5.png

When Do Analysts Deliver Information?

Pre-match

Data and video can be collated on opponents prior to facing them to highlight areas of strength and weakness and provide a comprehensive picture of what can be expected in upcoming matches. It enables coaches to formulate a strategy to counteract the opposition and exploit their weaknesses. Some analysts also analyse training sessions to assess the effectiveness of aspects of performance being tested in training and evaluate behavioural aspects that could influence team selection.

In-game

Performance analysts often code matches live, with statistical information and specific video instances shared between devices for review by coaches in real-time, and players at half-time. They generate continuous feedback for coaches to make timely changes during the course of the event. Video feeds and statistical data can be made immediately available in a coach’s iPad device or laptop, which is then reviewed by a coach prior to giving a half-time team talk. Alternatively, analysts may also go to the dressing room and show a coach clips and stats in person.

Post-match

Analysts often review team and individual performance in detail after the match has ended, allowing coaches to evaluate performance and plan future training. Post-match analysis feedback sessions play an integral role in the coaching process and analysts tend to be at the core of the information used in these sessions.

Fostering A Coach-Analyst Relationship

The most essential skill a Performance Analyst needs to have a successful performance impact in a team is their ability to be integrated within the coaching environment - to be the “right hand” of the coach. Analysts should focus on understanding the requirements for successful coaching practice and becomes an asset for the coach to succeed at their role. They should continuously seek opportunities to engage and connect with the head coach and the rest of the coaching staff. One of the most frequent opportunities to do so that are presented to analysts are during review sessions, where analysts sit down with coaches to discuss and assess the analysis together. It is then that analysts have a great opportunity to gain the trust of the coach and offer their own independent assessments to show their value. By gaining the coach’s trust, analysts are more likely to be consulted about team and player performance more regularly, thus obtaining further chances to demonstrate their value to the team and coaching staff. Trust can work in both ways, for the coach to know that the analyst is giving them relevant and valuable information but also for the analyst to know that the coach is going to understand and use that information in the correct way. It can also give the analyst a boost in confident to know that their coach considers them a competent and valuable member of staff. However, this trust can only be achieved by successfully fostering a positive working partnership with the coach through, amongst others, mutual respect, openness and honesty.

Sport Performance Analysis - Communication with Coaches 8.png

One of the first steps an analyst starting in a new team should aim to do during the building phase of the relationship with the coach is to clearly understand what the expectations of working practice and hierarchies are at their new club. By establishing an early understanding of the coaches’ methods and cementing the status of the relationship, the analyst can adapt their work to suit the preferences of the manager and start delivering positive results and gaining trust. Only when that trusting relationship has been established is the analyst able to adequately offer improvement to processes, such as tactical suggestions or offer new ideas for ways a coach could engage with their players. However, while there is sometimes room for negotiations around the design of analytical processes and defining the measures of successful performance, the common perception within most coach-analyst relationships is that the analyst is often limited to purely collecting the information as directed by the coach. This is especially the case with experienced coaches, who know what they want and how they want it, leaving analysts little room to deviate from the direct instructions on how analysis should be performed and delivered at the club.

Authoritarian coaches

A coach’s leadership position in the club’s hierarchy provide him or her with recognised power over their subordinates. They are perceived as experts thanks to their experience and knowledge, their status of role models awards them with referent power towards their players and staff, and their social status within the club is elevated providing them with legitimate power to reward or discipline others’ behaviours based on conformity or outcomes.

Unfortunately, in situations where coaches exert an authoritarian leadership style, an analyst’s expertise may be overshadowed by the legitimate power of the coach. The analyst’s scope is therefore reduced to carefully listening to requests and producing exactly what the coaches want. Often, these authoritarian coaches impose high workload levels and demand numerous resources from the analyst to support their needs when making reliable technical and tactical appraisals of performance. The domineering power exerted by these coaches over their athletes and backroom staff can truly shape the nature of their working relationships, including those with analysts. Analysts may feel that new ideas are at risk of falling on deaf ears or being shot down if the right relationship has not been reached with the head coach.

It is important that the analyst acknowledges the working environment in front them and learns to navigate the politics involved in succeeding in an elite sport environment. For instance, studies have shown that coaches often place significant importance to social interactions with other members of their backroom staff as they perceive them as a mechanism to maintain and control the balance of their status of power. This is why social gatherings, even when portrayed as non-work related, are often compulsory events for analysts to attend. Not only end of season awards or team meals during away travel but also get togethers or socials may often be considered obligatory socialising for an analyst. These situations often present opportunities for analysts to interact with coaches outside of the pressures of the competitive environment. A game of pool, a football kickabout or a round of golf removes everyone from the daily working environment and puts them in a relaxed situation in which social interactions can help build a more co-operative relationship between analysts, coaches and the wide backroom staff members. Even when at work, analysts should sit at the coaches table at lunch, be there for team meetings, and involve themselves where they can.

Managing conflict

A great challenge for analysts is to be able to effectively manage this coach-dominated relationship. However, the reality is that, due to factors like job insecurity, most analysts feel that the way to gain respect and trust from the coach is to offer their unconditional support to the coach, as they ultimately hold a position of maximum authority. They perceive success as their ability to anticipate a coach’s needs before being asked, proactively seeking new ways to understand the team’s performance.

Analysts are highly dependable on the relationship with their coach. Establishing a connection early on may be critical in dictating whether the coach would want the analyst to continue in the team, even before the analyst has had a chance to demonstrate his or her skills. In some cases, personality clashes with coaches may be decisive in the analyst’s future. This is why establishing and maintaining a positive relationship with coaches should be one of analysts’ top priorities. Whether there is true appreciation and respect towards the coaches and their decisions, or whether the analyst is struggling to find motivation when in a difficult working environment, being respectful at all times is key to survival in a dynamic, competitive and pressured industry. Similar to what happens with athletes, any conflicts against the coaches could jeopardise an analyst’s future career within elite sport. For instance, conflict may occur if an analyst continuously fails to meet a coach’s expectations. Even when pressure rises, analyst should be able to remain calm under this pressure and not let emotions interfere in their communication with coaches.

Unfortunately, since the hierarchical coach-analyst relationship is dictated by the coach, analysts will often see themselves on the losing end when challenging a coach, even when the coach is in the wrong. For these reasons, conflict management, both proactive and reactive, together with openness, positivity and motivation, become crucial elements in maintaining a positive working relationship between analysts and coaches. Any concerns or issues from analysts should be raised and communicated in the right way, at the appropriate time and providing adequate solutions.

Approachability and getting to know the individuals

Moreover, building strong working relationships with other cooperative and supportive colleagues can be extremely beneficial to analysts. An analyst should be able to navigate the micro-politics prevalent within high performance teams by establishing himself or herself as the expert in their field and within their remit of work by producing high quality work in a timely manner that contributes to a harmonious working environment. An analyst’s role is not limited to helping the team perform on the pitch but he or she should aim to help everyone in the club be better at their respective roles by leveraging their analytical expertise and enthusiasm in the sport to provide them with useful and valuable insights. They also need to be approachable to allow them to really engage with their coaches and peers and get to know them well at an individual level. Getting to know the coaches as individuals can make the analyst more sensitive to the ways in which each coach likes to be approached and given key information.

Analysts should be able to listen effectively and adapt their communication style not only to fit coaches but also with the wider backroom team and players. They should listen twice as much as they talk to be able to clearly understand and translate coach directions into numbers or quantifiable information. They should know when they have the coach’s full attention and if so, explain themselves in an easily understood manner, ensuring that the coach has understood, believed and accepted what the analyst is trying to communicate to them. Coaches are busy people. Therefore, analysts should be mindful of a coach’s time by being concise, clear, constructive and complete in their communication. Coaches do not always have time to drill down into the data, so it is important that they are presented with key insights that give a good indication of player performance in training and matches. Moreover, analysts tend to not have played the sport professionally before, therefore their opinions should always be backed up with evidence.

Motivation

Performance Analysts operate in a highly pressured and competitive industry. To succeed in such environments, motivation plays a key part in ensuring that the analyst is continuously giving 100% to their team and coaches. They are expected to be willing to go the extra mile to meet their coaches’ needs and expectations. This usually translates into not working set times but instead working unsociable hours around the schedule of the team, the coaches and the competition. For instance, analysts will frequently need to work long hours into the night to produce match reports of last night’s game. This setup requires analysts to have a strong sense of commitment to the overall team performance that motivates them to produce valuable information for coaches regardless of the costs in workload.

An analyst needs to be pushing their own boundaries and those of their coaches beyond the current knowledge. Coaches will not ask for something that they did not know could be done, it is for analysts to be motivated enough to continuously come up with innovative solutions to deliver performance insights. However, at the same time, analysts may be heavily dependent on the coach’s ability to clearly articulate and operationalise what they associate with success in the sport. This tricky situation may become a cause for frustration amongst analysts. It may happen that an analyst is asked to produce reports that never get used or materials for a meeting that never happens. Even in these situations when the analyst is sure that the work will be redundant, an analyst should be aiming to deliver on the work expected, as the risks of the work eventually being required but unavailable to coaches may seriously damage their relationship with the coach. Moreover, they need to be prepared for all eventualities. Coaches do not understand and do not want to understand why something is not working or why it may take so long. Analysts need to prepare for failure – both in equipment and analysis – and be prepared for last minute requests at all times.

Motivation is easier to find when there is a mutually respectful relationship with the coach. There needs to be a sense of ‘togetherness’ in the working environment that makes all members want to work towards a common goal. Good coaches foster these environments by making analysts want to work for them. They empower their backroom staff through willingness to listen to their inputs. However, analysts should reciprocate the coach’s willingness to listen to their inputs, as well as their respect and trust, by meeting their high standards through hard work, good time-keeping and good quality of work produced. They should always be meeting the specified deadlines at the highest possible quality of work. A hard-working ethos, underpinned by honesty and being approachable, leads to the desired productive coach-analyst relationships. Portraying motivation to coaches and other colleagues can lead to more supportive relationships in the whole. On the other hand, failing to meet deadlines will inevitably lead to losing the trust and respect from the coaches. Coaches may then begin to rely less on the analyst for decision-making and ignore their work and value.

Future opportunities

The relationship between the analyst and coach is so important that coaches would attempt to recruit analysts that they have worked with in previous roles when they gain new employment. This networking aspect to an analyst’s role expands beyond their current role. Maintaining previous relationships with past coaches can be beneficial to their long-term career. Future opportunities may arise where the analyst may be directly contacted by a former coach to join them in a new venture. This can become an extremely motivating experience and provide the analyst with greater job satisfaction and feeling that they are valued.

Citations:

  • Bateman, M., & Jones, G. W. (2019). Strategies for maintaining the coach-analyst relationship within professional football utilising the COMPASS Model: The Performance Analyst’s perspective. Frontiers in psychology10, 2064.

  • BBC (2020) Performance feedback in sport. BBC. Link to article.

  • English Institute of Sport (2020) Why is there a Performance Analysis team at the EIS? Link to article.

  • Future Active (2020) How to become a Sport Analyst. Future Active. Link to article.

  • Haines, M. (2013). The role of performance analysis within the coaching process. Mike Haines Performance Analyst. Link to article.

  • McGarry, T., O'Donoghue, P., Sampaio, J., & de Eira Sampaio, A. J. (Eds.). (2013). Routledge handbook of sports performance analysis. Routledge.

  • Sprongo (2020) The many benefits of video analysis. Sprongo. Link to article.

Working in Performance Analysis: Roles, Skills and Responsibilities

Types Of Roles In Performance Analysis

Depending on the size and organisational structure of the sporting club or institution, the range of responsibilities and job title of a Performance Analyst may vary significantly. Most Performance Analysis roles, particularly in smaller teams or lower divisions, continue to encompass a generic list of responsibilities across the different areas that make up the discipline, from handling filming equipment to performing data analytics and managing databases. These roles, usually titled Performance Analyst, often provide the analyst with a great level of autonomy by relying on them to effectively manage all processes, equipment and communication related to the analysis of performance within team. In these roles, often supervised by senior peers or team leads, the Performance Analyst is responsible for successfully executing the existing filming, data collection and analysis delivery processes already in place at the club but also for helping to shape and improve the practices of the team in respect to the analysis of team and player performance.

In elite sporting institutions of medium to large size, Performance Analysis departments are considerably more established within the structure of the backroom staff than in lower-tier clubs. These Performance Analysis departments may be composed of a larger number of analysts, with each analyst’s role and responsibilities focused on a particular team or area of the club as the wider responsibilities of the Performance Analysis department are more clearly divided amongst its staff members. In these organisations, Performance Analysts may be given more specific job titles to reflect the team or area they support, such as Academy/Development Performance Analyst, Women’s Performance Analyst or First Team Performance Analyst. The level of experience in the role, club or field may also define an analyst’s title, ranging from Performance Analysis Intern, to Performance Analyst, to Senior Performance Analyst. Furthermore, these wider Performance Analysis teams are often overseen by a Head of Performance Analysis or a Lead Performance Analyst that defines the strategy to follow by the team and ensures consistency of practices and transfer of knowledge across all analysts.

Top-tier elite clubs, such as leading Premier League football clubs, benefit from much larger analysis departments, where the responsibilities of a Performance Analyst are often sub-divided into further specialised roles, such as Data Scientist, Recruitment Analyst, Opposition Analyst or Match Analyst. As technology and the reliance of data analysis to clubs’ success has grown over the years, the function of Performance Analysis has dramatically grown in size and importance within top-tier clubs, who increasingly want to achieve more through data to obtain a competitive edge over rivals. This phenomenon has given rise to a number of specialised roles focusing on narrower elements of the analytical process of a team’s or player’s performance. As technologies and analysis processes become more complex, the range of skills and responsibilities of a Performance Analyst is increasingly becoming more convoluted and varied. Different specialised roles may require different experiences and may place different emphasis on some skills over others, whether those are highly technical skills (i.e. programming languages like Python or R), knowledge in the sport (i.e. coaching certificates) and/or filming and video editing experience.

Responsibilities As A Performance Analyst

As mentioned in the previous section, the responsibilities of a Performance Analyst may vary between club to club, team to team and role to role. However, ultimately, all roles of a Performance Analyst share the common goal of providing objective feedback to coaches and players on performance. Therefore, there is a shared set of responsibilities present in most Performance Analysis roles that represent the core nature of the field of work. These include:

Filming:

Filming team training and home and away matches is a key responsibility of most Performance Analyst roles. This involves the handling of camcorders, tripods, SD cards and other necessary filming equipment and software while ensuring its maintenance to a high working standard. In some clubs and competitions, matches are recorded by TV camera operations and footage is sent to the respective Performance Analysis teams. However, clubs may require Performance Analysts to film additional angles or film during matches that are not broadcasted in order to obtain the footage for later analysis. When footage is obtained by Performance Analysts, certain competitions follow footage exchange rules amongst teams to ensure the same video material is available for both the home and away team.

Data collection:

Video-analysis software is core to Performance Analysis. A Performance Analyst is required to use tools such as Sportscode, Dartfish or Nacsport to record key performance indicators (KPIs) and collate event data from training and match footage. They are responsible for developing new techniques, protocols and systems to gather event data on relevant actions that take place on the pitch. The collection of such data allows Performance Analysts to produce statistical and video-based feedback to be shared with the coaching staff and the wider department. Analysts are also responsible for managing the various statistical databased containing player and team data. These datasets may be complemented with external data obtained online or from data providers, such as Opta.

Data analysis:

Performance Analysts are responsible for producing detailed team and opposition analysis, as well as readable match reports, in both written and video format for coaching and technical staff to interpret. These tasks may also involve the creation of team and individual KPI databases, used for trend analysis of performances over a period of time. The reports produced by Performance Analysts help coaches make informed decisions on a variety of areas, from tactical decisions to team selection and player recruitment. Analysts in roles focusing on player development, such as Academy, also produce individual player analysis with educational programmes and content for players to review their individual progression.

Delivery of analytical insights:

The distribution of the work produced by Performance Analysts may take different forms. Often coaching staff require Performance Analysts to edit and distribute relevant footage, such as key highlights of a training session or match, to key members of staff or players. For example, a Performance Analyst may create a summary clip of all positive actions a player has made during a game together with one of those instances where the player may have been caught out of position. These clips, together with additional analytical reports, may be used in appropriate meetings between coaches and players. A Performance Analyst is often required to attend, contribute and provide high-quality presentations using video and key statistics at such meetings to aid the feedback process. Furthermore, Performance Analysts in Academy roles may also be required to facilitate appropriate communication methods, such as workshops, to inform and educate younger athletes and their coaches in the effective use of performance analysis insights.

Some specialised roles, such as Academy Performance Analysts, may include additional responsibilities, such as ensuring that a consistent approach to analysis of player performance is maintained across all age categories. In these roles, the focus of coaches may significantly differ from those of the first team coaching staff, as priorities are shifted to the individual development of players rather than the competitive success of the club. Therefore, more focus is placed on the progression and monitoring of players and the creation of individual development programmes to aid player retention decisions. These priorities mean that analysts need to maintain slightly different video and statistical databases that emphasise on specific development KPIs, as well as create age and learning style appropriate educational content for young players to understand their performance against their individual goals.

Moreover, data-focused roles within the analysis of team and player performance have started a transition into the field of Data Science and Machine Learning. For instance, the role of Data Scientist is increasingly emerging in player analysis, scouting and recruitment. These positions differ from the conventional role of a Performance Analyst as they require a higher degree of technical know-how. Data Scientists or similar positions are often responsible of developing statistical models and metrics to identify talent and opportunities across global markets using specific programming languages and analytics solutions. They heavily focus on the collection, analysis and visualisation of data and intelligence from vast internal and external data sources and databases. In some cases, their responsibilities also include the development of data-driven tools and platforms to help maximise the effectiveness and efficiency of the department and club.

Lastly, as a wider member of staff in such a competitive sporting environment, a Performance Analyst is required to follow certain procedures to adhere to a strict code of confidentiality in respect of any information relating to their club’s operations, as well as any other regulations and standards. For instance, while working in certain sensitive positions, such as an Academy, Analysts are required to strictly follow safeguarding (child protection), health, safety and equal opportunity procedures and practices dictated by their club. These roles involving young athletes often require a DBS criminal record check prior to commencing employment. Other procedures often expected to be followed by all members of backroom staff in a sporting institution include attending continuous personal development events, arranged by clubs to enhance personal knowledge, skills and expertise amongst their staff. Nevertheless, successful Performance Analysts often keep themselves up-to-date with current research, technology and the latest developments in Sports Analysis practice and bring ideas to assist with continuous improvement of its club.

Other non-role related responsibilities include mobility and unsocial hours of work. Due to the high mobility of teams during competition, most clubs expect their analysts and members of backroom staff to have a driving license to be able to travel to matches and training grounds. Also, since matches are often played outside the standard office hours, Performance Analysts are expected to be able to work evenings and weekends, when most of the sporting action takes place. This may also include overnight stays at certain locations during away games and competitions.

Skills Required In Performance Analysis

The skills demanded for a specific role will depend on the various responsibilities of the position, as well as the level of experience and specialisation required to carry out the role (i.e. Data Scientist may require a higher level of technical skills). Nevertheless, there are set of common skills often looked for by teams when recruiting for a new Performance Analysts. These include:

Experience:

Most vacancies in Performance Analysis look for candidates with an undergraduate degree in a sports-related field at 2:1 or above. Some may even prefer a Masters qualification. Aside from academic qualifications, most full-time roles will require prior experience supporting athletes and coaches to improve their performance through the provision of performance analysis or similar multi-disciplinary analytical support using sports data within an elite or high-performance sport environment. For Senior or Lead positions, clubs may look for candidates with experience in developing and implementing innovative Performance Analysis programmes and ideas according to the results of needs, assessment and feedback from coaches and other support staff. For other roles where Performance Analysts may be required to perform a wider variety of roles supporting the coaching staff, they may be required to have some generic sports science knowledge and, in some cases, coaching experience to demonstrate good knowledge of the tactical aspects and other fundamentals of the sport. For example, a Performance Analyst role in a top-tier football club may demand an excellent understanding of football tactics, game management and talent identification.

Technical Skills:

Technical demands of Performance Analyst roles continue to evolve as technology advances in the field. However, the ability to use videoanalysis software packages (i.e. SportsCode, Dartfish, Nacsport, etc.) is a must for any role in the field, as they represent a critical component in the process of data gathering and analysis of team and player performance. This also means that Performance Analysts need to have the ability to operate filming equipment to obtain and handle sport footage and be highly proficient in Performance Analysis computer equipment and software to collect, transfer and store relevant video files across systems. Furthermore, the analysis process of the collected data requires Performance Analysts to have experience handling datasets with analytical software (i.e. Microsoft Excel) and have proficient data analysis skills to produce performance profiling, trend analysis, data mining and managing large longitudinal datasets that systematically track, monitor and objectify performance. Lastly, the outputs of the analysis work need to be effectively presented using data visualisation systems and reporting tools, such as Tableau, for clear and easy interpretation by coaches and relevant parties.

For roles involving aspects of data science and machine learning, skill requirements tend to vary from those of conventional Performance Analyst roles. These roles involve the automation, development and delivery of complex data-driven insights. Vacancies for these types of roles tend to look for knowledge of certain programming languages, such as R or Python, as well as a good understanding of querying and management of databases (i.e. SQL, PostgreSQL, etc.). Other technical skills required may include the ability to work with Rest APIs, JSON scripts and manage certain AWS or cloud-based solutions, due to the greater involvement in processing and dissemination of large datasets using the latest data science technologies and processes. Analysts in these positions also need to effectively distribute analytical insights using a variety of BI tools, such as Power BI, Tableau, Domo or Looker, therefore an extensive knowledge of such systems is often a requirement.

Soft Skills:

The role of a Performance Analyst demands certain personal abilities, or soft skills, in order to be successful at navigating the intricacies of a competitive, high pressure sporting environment where staff are often required to work under pressure to meet deadlines. While the core analytical responsibilities of an analyst demand a degree of passion about providing insights based on data and being naturally inquisitive about gathering new intel for the team, being able to effectively deliver such insights is critical to the role. A Performance Analyst needs to be able to effectively communicate and present complex data in terms that are easily understood by a wide variety of audiences. This effective communication not only involves the clear articulation of complex analytical ideas but also the clear understanding of the needs and what is important to elite athletes and coaches in a high-performance environment. This understanding can be obtained by having robust interpersonal skills that enable the fostering of productive relationships that allow analysts to successfully communicate with the wider team, coaches and during individual player interactions. Understanding each player and coach needs through strong relationships with them can help analysts become proactive and innovative at solving specific problems that help the team succeed, influence their peers toward positive change, and show willingness to work as a part of the team working towards broader team objectives. Lastly, under such a high-pressure environment it is important that Performance Analysts successfully and independently prioritise their workload and allocate time to their own professional development. As a rapidly changing and evolving field, analysts need to be constantly learning and researching new scientific methodologies, new data practices and innovative approaches towards intel and data insights that can provide their team with an extra competitive edge over rivals.

Certificates/Accreditation:

While accreditation is not required in order to undertake a Performance Analysis role, unlike in other sport science disciplines, there are clubs that recommend their analysts to obtain an ISPAS accreditation. While ISPAS has not yet been widely established as an official accreditation for Performance Analysis roles, it can be used as a way of demonstrating verifiable experience in the field of Performance Analysis. Additionally, certain roles may also request coaching and talent ID accreditation depending on their responsibilities. For instance, a Performance Analyst role for a first team position may require the analyst to obtain a Level 2 coaching certificate, while a Recruitment Analyst may require a FA Talent ID Level 2 accreditation.

Types Of Employment Offered In Performance Analysis

As a highly competitive field with a limited number of sporting clubs offering vacancies on a regular basis, most Performance Analysts get their foot in the door through season-long work placements. These opportunities are often offered in partnerships with universities across the country as part of graduate or post-graduate degrees in the field. For example, Reading FC recently offered a 2020/21 season-long work placement with their First Team Analysis department in partnership with the University of Worcester, as part of their MSc (Hons) Applied Sports Performance Analysis programme. The majority of these work placements are unpaid, and only include limited travel expenses. Others offer either a small compensation or a partial or full contribution towards the tuition fees of the MSc programme. This contribution may also be offered in the form of a bursary by the university themselves rather than by the club. However, these opportunities are not perceived as employment but instead act as a work experience opportunity to develop the knowledge and skills required to work as a performance analyst in elite sport. They simply offer a high-quality learning experience for future employment.

Part-time vacancies are the next most common offering in the field of Performance Analysis. These are usually task-specific and demand a very precise set of skills for a short period of time. For instance, a football team may need a Performance Analyst to code a number of pre-season friendlies and provide match analysis reporting for a limited set of matches. These services may be paid per match (i.e. £30 per match) or at a pre-agreed hourly rate. Sport betting agencies also offer this type of data collection roles, often supporting the match coding and analysis of a specific league or competition with fixed hourly contracts. On the other hand, an alternative form of part-time employment can be carried out through contracting/freelancing, where analysts are contracted on a project basis based on the changing needs of a club or set of clubs at a given time.

While less common than the prior two forms of employment, full-time opportunities in Performance Analysis have been increasingly growing over the years thanks to the development of the field and the growing reliance on the effective use of technology within numerous elite sporting institutions. Full-time roles tend to come on fixed-term contracts, similar to other functions in a club’s backroom staff. However, these vacancies often require extensive experience in a performance analysis function within a high-performance environment or a similar sport scientist role that shares common responsibilities. As more and more clubs make use of the system and process in Performance Analysis, full-time employment opportunities will most likely continue to grow, as well as evolve into their own sub-functions within the data science and technology space.

Collecting Sports Data Using Web Scraping

What Is Web Scraping?

Web scraping is the process of automatically extracting data and collecting information from the web. It could be described as a way of replacing the time-consuming, often tedious exercise of manually copy-pasting website information into a document with a method that is quick, scalable and automated. Web scraping enables you to collect larger amounts of data from one or various websites faster.

The process of scraping a website for data often consists on writing a piece of code that runs automatic tasks on our behalf. This code can either be written by yourself or executed through a specialised web scraping program. For example, by simply writing a few basic lines of code, you can tell your computer to open a browser window, navigate to a certain web page, load the HTML code of the page, and create a CSV file with the information you want to retrieve, such as a data table.

These pieces of code - called bots, web crawlers or spiders - use a web browser in your computer (i.e. Chrome, Firefox, Safari, etc) to access a web page, retrieve specific HTML elements and download them into CSV files, Excel files or even upload them directly into a database for later analysis. In short, web scraping is an automated way of copying information from the internet into a format that is more useful for the user to analyse.

The process of web scraping follows a few simple steps:

  1. You provide your web crawler a page’s URL where the data you are interested in lives.

  2. The web crawler starts by fetching (or downloading) a page’s HTML code - the code that represents all the text, links, images, tables, buttons and other elements of the website page you want to get information from – and store it for you to perform further actions with it.

  3. With the HTML code fetched, you can now start breaking it down to identify the key elements you want to save into a spreadsheet or local database, such as a table with all its data.

For example, you can use web scraping to collect the results of all Premier League matches without having to manually copy-paste every results from a web page with such information. A web crawler can do this task automatically for you. You would first provide your web crawler or web scraper tools the URL of the page you want to scrape (i.e. https://www.bbc.co.uk/sport/football/premier-league/scores-fixtures). The web crawler will then fetch and download the HTML code from the URL provided. Finally, based on the specific HTML elements you requested the web crawler to retrieve it would export those elements containing match information into a downloadable CSV file for you in milliseconds.

What Is Web Scraping Used For?

Web scraping is widely used across numerous industries for a variety different purposes. Businesses often use web scraping to monitor competitor’s prices, monitor product trends and understand the popularity of certain products or services not only within their own website but across the web. These practices extend to market research, where companies seek to acquire a better understanding of market trends, research and development, and understanding customer preferences.

Investors also use web scraping to monitor stock prices, extract information about companies of interest and keep an eye on the news and public sentiment surrounding their investments. This invaluable data helps their investment decisions by offering valuable insights on companies of interest and the macroeconomic factors affecting such enterprises, such as the political landscape.

Furthermore, news and media organisations are heavily dependent on timely news analysis, thus they leverage web scraping to monitor the news cycle across the web. These media organisations are able to monitor, aggregate and parse the most critical stories thanks to the use of web crawlers.

The above examples are not exhaustive, as web scraping has dramatically evolved over the years thanks to the ever-increasing availability of data across the web. More and more companies rely on this practice to run their operations and perform thorough analysis.

What Scraping Tools Are There?

Websites vary significantly in their structure, design and format. This means that the functionality needed to scrape may vary depending on the website you want to retrieved data from. This is why specialised tools, called web scrapers, have been developed to make web scraping a lot easier and more convenient. Web scrapers provide a set of tools allowing you to create different web crawlers, each with their own predefined instructions for the different web pages you want to scrape data from.

There are two types of web scrapers: pre-built software and scraping libraries or frameworks. Pre-built scrapers often refer to browser extensions (i.e. Chrome or Firefox extensions) or scraping software. These type of scraping tools require little to no coding knowledge. They can be directly installed into your browser and are very easy to use thanks to their intuitive user interfaces. However, that simplicity also means their functionality may be limited. As a result, some complex website may be difficult or impossible to scrape with these pre-built tools. Some examples of scraping apps and extensions include:

Scraping frameworks and libraries offer the possibility of performing more advanced forms of scraping. These scraping frameworks, such as python’s Selenium, Scrapy or BeatifulSoup, can be easily installed in your computer using the terminal or command line. By writing a few simple lines of code, they allow you to extract data from almost any website. However, they require intermediate to advance programming experience as they are often run by writing code in a text editor and executing the code through your computer’s terminal or command line. Some example of open-source scraping frameworks include:

Scraping Best Practices. Is It Legal?

Web scraping is simply a tool. The way in which web scraping is performed determines whether it is legitimate web scraping or malicious web scraping. Before undertaking any web scraping activity, it is important to understand and follow a set of best practices. Legitimate web scraping ensures that the least amount of impact is caused to the website where the data is being scraped.

Legitimate scraping is very commonly used by a wide variety of digital businesses that rely on the harvesting of data across the web. These include:

  • Search engines, such as Google, analyse web content and rank it to optimise search results.

  • Price comparison sites collect prices and product descriptions to consolidate product information.

  • Market research companies evaluate trends and patterns on specific products, markets or industries.

Legitimate web scraping bots clearly identify themselves to the website by including information about the organisation or individual the bot belongs to (i.e. Google bots set their user agents as belonging to Google for easy spotting). Moreover, legitimate web scraping bots abide by a site’s scraping permissions. Websites often include a robots.txt file appended to their URLs describing which pages are permitted to be scraped and which ones disallow scraping. Examples of robots.txt permissions can be found in https://www.bbc.co.uk/robots.txt, https://www.facebook.com/robots.txt and https://twitter.com/robots.txt. Lastly, legitimate web scraping bots only attempt to retrieve what is already publicly available, unlike malicious bots that may attempt to access an organisation’s private data from its nonpublic database.

On the other side of legitimate web scraping there are certain individuals and organisations that attempt to illegally leverage the capabilities of web scraping to directly undercut competitor prices or steal copyrighted content. This may often cause financial damage to a website’s organisation. Malicious web scraping bots often ignore the robots.txt permissions, therefore extracting data without the permission of the website owner. They also impersonate legitimate bots by identifying themselves as other users or organisations to bypass bans or blocks. Some examples of malicious web scraping include spammers that attempt to retrieve contact and personal detailed information of individuals to later send fraudulent or false advertising to a large number of user inboxes.

This increase in illegal scraping activities have significantly damaged the reputation of web scraping over the years. Substantial controversy has been drawn to web scraping, fueling a lot of misconceptions surrounding the practice of automatic extraction of publicly available web data. Nevertheless, web scraping is a legal practice when performed ethically and responsibly. Reputable corporations such as Google heavily rely on web scraping to run their platforms. In return, Google provides considerable benefits to the websites being scraped by generating large amounts of traffic to such websites. Ethical and responsible web scraping means the following:

  • Read the robots.txt page of the website you want to scrape and look out for disallowed pages (i.e. https://www.atptour.com/robots.txt).

  • Read the Terms of Service for any mention of web scraping-related restrictions.

  • Be mindful of the website’s bandwidth by spreading your data requests (i.e. setting a delay and interval of 10-15 seconds per request instead of hundreds at once).

  • Don’t publish any content that was not meant to be published in the first place by the original website.

Where To Find Sports Data

A league’s official website is a good starting point to gather basic sports data about a team’s or athletes performance stats and start building a robust sports analytics dataset. However, nowadays, many unofficial websites developed by sports enthusiasts and media websites contain invaluable information that can be scraped for sports analysis.

For example, in the case of football, the Premier League website’s Terms & Conditions permits you to “download and print material from the website as is reasonable for your own private and personal use”. This means that you may scrape their league data to obtain information about fixtures, results, clubs and players for your own analysis. Similarly, BBC Sports currently permits the scraping of its pages containing league tables and match information.

The data obtained from the Premier League and BBC Sports websites can later be easily augmented by scraping additional non-official websites that offer further statistics on match performances and other relevant data points in the sport. Some example websites include:

The same process applies to any other sports. However, the structure and availability of statistics in different official sport websites significantly vary from sport to sport. The popularity of the sport also dictates the number of non-official analytical websites offering relevant statistics to be scraped.

Scraping Example: Premier League Table

Below is a practical example on how to scrape the BBC Sports website to obtain the Premier League table using various scraping methods. The examples are designed as of the structure of BBC’s website at the time the article is published. Possible future changes by the BBC to their Premier League table page could mean that the HTML of the page slightly changes, therefore the scraping code in the example below may required some readjustment to reflect those design changes.

Using Web Scraper (Google Chrome extension)

1. Install Web Scraper (free) in your Chrome browser.

2. Once installed, an icon on the top right hand side of your browser would appear. This icon opens a small window with instructions and documentation on how to use Web Scraper.

 
Sport Performance Analysis - Web Scraping 1.png
 

3. Go to the BCC Sports website: https://www.bbc.co.uk/sport/football/tables

4. Right click anywhere on the page and select “Inspect” to open the browser Dev Tools (or press Option + ⌘ + J on a Mac, or Shift + CTRL + J on a Windows PC).

 
Sport Performance Analysis - Web Scraping 2.png
 

5. Make sure the Dev Tools sidebar is located at the bottom of the page. You can change its position under options and Dock side within the Inspect sidebar.

6. Navigate to the Web Scraper tab. This is where you can use the newly installed Web Scraper tool.

 
Sport+Performance+Analysis+-+Web+Scraping+3.jpg
 

7. To scrape a new page, you first need to create a new web crawler or spider by selecting “Create new sitemap”.

 
Sport+Performance+Analysis+-+Web+Scraping+4.jpg
 

8. Give the new sitemap a comprehensive name, in this case “bbc_prem_table” and then paste the URL of the web page you want to obtain data from: https://www.bbc.co.uk/sport/football/tables. Then click on “Create sitemap”.

 
Sport Performance Analysis - Web Scraping 5.png
 

9. Now that the spider is created, you would need to specify the specific elements of the page you would like data to be extracted from. In this example, we are looking to extract the table. To do so, click on “Add a new selector” to specify the HTML element that the web crawler needs to select and look for data in.

 
Sport+Performance+Analysis+-+Web+Scraping+6.jpg
 

10. Give the selector a lowercase name under “Id” and set the Type as a “Table”, since we will be extracting data from a table element within the HTML code of the page.

 
Sport Performance Analysis - Web Scraping 7.png
 

11. Under the Selector field, you would need to specify the specific element on the page that you would like to target. Since we have already specified in the field above that the element is a Table, by using the option “Select” and then clicking on the league table on the BBC page, Web Scraper will auto-select the right elements for us to target. Once you click on “Select” under the “Selector” field, hover over the table until it turns green. Once you are certain that the table is correctly highlighted, click on it until it turns read and the input bar reads “table”. Then press “Done selecting!” to confirm your selection.

 
Sport Performance Analysis - Web Scraping 8.png
 

12. The table header and row fields should now be automatically populated by Web Scraper, and a new field called Table columns should have appeared at the button of the window. Make sure the columns have been correctly captured from the table and change the column names to lowercase, since Web Scraper does not allow for uppercase characters.

 
Sport Performance Analysis - Web Scraping 9.png
 

13. Above the Table columns. Check the box for “Multiple” items so that the web crawler extracts more than one row of data from the table, rather than just the data for the first row (first team).

14. Now that the selector is correctly configured, click on “Save selector” to confirm all the settings and create the selector.

15. You are now ready to scrape the table. Go to the second option of the top menu (Sitemap + name of your new sitemap) and select “Scrape”. Leave the intervals and delay to 2s (2000ms) and select “Start scraping”. This will open and close a new Chrome window where your web crawler will attempt to extract the data.

 
Sport Performance Analysis - Web Scraping 10.png
 

16. Once the scraping is done. Click on “refresh” next to the text “No data scraped yet”. This will display the data scraped.

 
Sport Performance Analysis - Web Scraping 11.png
 

17. To download the data to a CSV file. Select the second option on the top menu once again and click on “Export data as CSV”. This will download a file with the Premier League data you have just scraped from BBC Sports.

 
Sport Performance Analysis - Web Scraping 12.png
 

Using Python’s BeautifulSoup

1. Open your computer’s command line (Windows) or Terminal (Mac).

2. Install PIP to your computer by typing the below line in your command line. PIP is a python package manager that allows you to download and manage packages that are not already available with the standard python installation.

curl https://bootstrap.pypa.io/get-pip.py -o get-pip.py

3. Install Python, BeautifulSoup and Requests packages. These packages are required to write and execute the python code that will perform your scraping. Enter the following lines and press Enter, one by one, in your command line or terminal:

pip install python
pip install requests
pip install bs4

4. Open a text editor. This is where you will write your scraping code. If you don’t already have a text editor in your computer, consider downloading and installing Atom or SublimeText.

5. Create a new file and name it, for example, “prem_table_spider.py”. The “.py” extension at the end of the file name tells you text editor that it is a python file. Save the file to your Desktop for easier access later on.

6. The first lines of code refers to the package imports necessary to run the remaining of the script you will write. The packages needed in this case are “requests“ to get the HTML from the BBC page, “bs4” to use the tools provided by BeautifulSoup to select elements within the downloaded HTML, and “csv” to create a new CSV file where the data will be exported to.

import requests
from bs4 import BeautifulSoup
import csv

7. The next line of code will create a blank CSV file to store the collected data. Use the “csv.writer” function to create the file and give the file a name (i.e. prem_table_bs) and a mode of write (“w”) to enable python to write into this newly created file.

output_file = csv.writer(open('prem_table_bs.csv', 'w'))

8. After the CSV file is created, we will then want the code to create some table headers for the data we are going to be exporting. Use a “writerow” function that adds a new row of data to the CSV file. This row of that will simply be the header names that are shown in the league table from the BBC page.

output_file.writerow(['Position', 'Team', 'Played', 'Won', 'Drawn', 'Lost', 'For', 'Against', 'GD', 'Points'])

9. Now that the file is setup, the next steps will consist on writing the actual web scraping code. The first step is to provide the web crawler with the URL of the page we want to extract information from. This is done using the requests package. We use the “requests.get” function with the URL as an argument to extract the HTML from the BBC Sport football tables page. We save the results of this request as a variable called “result”.

result = requests.get("https://www.bbc.co.uk/sport/football/tables")

10. From the “result” obtained when getting the page’s HTML, we are only interested in its content. The get function offers other elements, such as headers or response status codes, which will not be of use for us in this example. To specify that we only want to work with the content, we save the “content” from the “result” into a new variable labelled “src” (source) for later use.

src = result.content

11. We have successfully extracted the HTML code from the BBC Sports page and saved it into a variable “src”. We can now start using BeautifulSoup on “src” to select the specific elements from the page that we want to extract (i.e table, table rows and table data). First, we need to tell BeautifulSoup to use the “src” variable we’ve just created containing the HTML content from the BBC Sports page by writing the following line. This line of code will set a new BeautifulSoup HTML parser variable called “soup” that uses the “src” contents:

soup = BeautifulSoup(src, 'html.parser')

12. Now the BeautifulSoup is connected to the BBC page’s HTML from the “src” variable, we can breaking down the HTML elements inside of “src” until we find the data we are after. Since we are looking for a table, this will involve selecting the <table> HTML element, extracting the <tr> (table rows) and then gathering each <td> (table data) from each row.

First, we set a new variable called “table” that represents all the <table> elements from the page. Since we use the “find_all_” function, we will receive a list of all tables. However, since there is only one table on the BBC’s page, that list will only contain one item. To retrieve the league table from the “table” list we need to set a new variable called “league_table” refers to the first item from such list (at index 0).

table = soup.find_all("table")
league_table = table[0]

13. With the league table now selected, we can now extract each row of data by running a new “find_all” function from the league_table that looks for all HTML elements with the tag <tr> (table row). Each row of the table will be a different team therefore we can label this new list of table rows “teams”.

teams = league_table.find_all("tr")

14. Finally, we can now create a for loop that iterates through every row in the table and extracts the text from every column item (<td> or table data). On every loop, python will assign the values of each <td> element in the row to a specific variable (i.e. the first element at index 0 will be league position of the team). After every loop (row) is processed, a new row of data will be written in the CSV file that was set up at the start of the code. Save the file. This is your completed scraping code.

for team in teams[1:21]:

    stats = team.find_all("td")

    position = stats[0].text
    team_name = stats[2].text
    played = stats[3].text
    won = stats[4].text
    drawn = stats[5].text
    lost = stats[6].text
    for_goals = stats[7].text
    against_goals = stats[8].text
    goal_diff = stats[9].text
    points = stats[10].text
    
    output_file.writerow([position, team_name, played, won, drawn, lost, for_goals, against_goals, goal_diff, points])
Sport Performance Analysis - Web Scraping 13.png

15. To run the code, open your command line or terminal once again. Navigate to the Desktop where you code file was saved. You can navigate backwards through your directories by typing “cd ..” in the command line, and navigate into a specific directory by typing the name or path of the directory after “cd” (i.e. “cd name_of_folder”). Once you are located in your Desktop directory (the name of the directory appears on the left hand side of each command line), you can run the web crawler file using the following command:

python prem_table_spider.py

Once run, you should find a new CSV file inside your Desktop folder that contains the Premier League table data you have just scraped.

Citations

  • Imperva (2020). Web scraping. Imperva. Link to article.

  • Perez, M. (2019). What is Web Scraping and What is it Used For? Parsehub. Link to article.

  • Rodriguez, I. (). What Is Pip? A Guide for New Pythonistas. Real Python. Link to article.

  • Scrapinghub. (2019). What is web scraping? Scrapinghub. Link to article.

  • Toth, A. (2017). Is Web Scraping Legal? 6 Misunderstandings About Web Scraping. Import.io. Link to article.

Setting Up Performance Analysis Equipment On Matchday

The following guide explains the setup process of Performance Analysis equipment during match days. This setup is frequently used in a number of major sports, particularly in those sports where analysts and coaches sit close to each other. However, the level of venue infrastructure can significantly vary between sports, clubs and divisions. Therefore, the same setup is not always possible and analysts need to have contingency plans at hand to be able to achieve the objectives of obtaining match footage, generating statistics and sharing real-time insights with coaches.

The example presented below represents a relatively simple setup often used in events with little to no technical infrastructure available in the match venue and where coaches are in close proximity to the analysts. This is frequent in sports such as Rugby Union where the coaching staff is located in the stands or gantry where the analysts perform their live coding. The equipment setup described here can easily be transported between venues, quickly assembled and later dismantled after the match. It provides sufficient flexibility to be used in a wide range of sporting events at different levels, from academy teams to elite matches.

Scenario:

The hypothetical match setup in this guide covers a scenario where two performance analysts code the match live as it takes place. Three coaches sit next to them in the gantry of the stadium, each with a laptop available in from of them. As the match is played, the performance analysts import the video feed received from the cameras into SportsCode Elite. They then use the software’s live coding capability to generate live statistics, such as possession in the different pitch zones, number of tackles, shots, infractions (penalties, cards, fouls, etc.) and other relevant match actions.

Coaches have access to the same SportsCode Elite file from the performances analysts available in their laptops. By opening the SportsCode file on their own laptops, coaches can review all key statistics generated by the analysts in real-time and use the information to make immediate tactical decisions. They also have access to the coded timeline, allowing them to replay footage of any actions or incidents from the match that they wish to review.

Objectives:

  • Obtain video files of two different camera angles for post-match analysis

  • Generate live statistics and video replays of key actions in real-time

  • Display key statistics to coaches for immediate tactical decision-making

Personnel:

  • Camera operators (usually Performance Analysts if event is not broadcasted) x2

  • Performance Analysts x2

  • Team coach x3

Technical Equipment:

  • HD Camcorders x2

  • Camera Tripods x2

  • SD Cards x2

  • SDI Cables x2

  • Blackmagic Design SDI to HDMI Converters x2

  • MacBook Laptops (x5)

  • SportsCode License (x5)

  • Ethernet Router

  • Ethernet Cables (x5)

Setup:

Sports Performance Analysis - Equipment Setup-01.jpg

Filming

Two HD camcorders film the match in two different angles: one camera films a wide angle capturing full areas of the pitch to evaluate team structure and positioning of players while the other camera films a tight angle closing in on the play to capture the players’ technique and closer movements. Since the footage from these two cameras needs to be stored for post-match analysis, each camera should be equipped with an SD card that contains sufficient capacity to store the footage from the full length of the game. The storage capacity of the SD card would greatly depend on the length of the match and the video quality format of the footage recorded.

In most major events, camera operators from TV broadcasters usually operate their own advanced filming equipment that already capture multiple angles of the pitch in high definition. This means that performance analysts may not require to operate their own cameras to capture match footage during these events. Instead, if the infrastructure permits, video feeds are shared to all interested parties (i.e. home and away Performance Analysts teams) by the TV camera operators by sharing an end of their Serial Digital Interface (SDI) cables connected to their cameras. These SDI cables are essential for the type of video transmissions required in sporting events, as they allow for stable transfer speeds of around 270 megabits per second in an uncompressed format. They also ensure that video quality is maintained from the camera to the receiving device.

Whenever a video feed from an HD camcorder is sent directly to a laptop via an SDI cable, a converter needs to be used to be able to connect the feed to the laptop, as most common laptops do not have SDI ports. A popular converter used in Performance Analysis is Blackmagic Design’s Mini Converters. Like with most adapters, the SDI cable coming from the camera is plugged into the mini converter, then a USB cable is then plugged from the mini converter to the laptop.

In the scenarios where a video feed is sent directly to the analyst’s laptop from a camera that does not have the analyst’s SD card inserted in it to store the footage, it is important for the analysts to record and store the incoming video feed in their laptop for later post-match analysis. To do so, performance analysts often use media capture software, such as Blackmagic Design’s Media Express, to log and capture the footage coming from the SDI video feed and store it as a video file in their computers. Often this process is followed regardless of whether there are other means to obtain the footage (i.e. SD cards or shared between Performance Analysts teams), acting as a backup option to avoid the loss of footage if any of the primary methods were to fail.

Coding

Once the filming equipment has been setup, analysts can now make use of the incoming video feed to analyse the match in real-time. The video feed cables are connected to each of the analyst’s laptops via an USB cable coming from the SDI converters. One of the analysts would input the footage into their laptop from the camera filming a wide angle while the other analysts would do the same with the tight angle.

Now that the laptops are receiving the footage from the game, analysts can open SportsCode Elite and use the live footage to code events in a new SportsCode timeline. Using the SportsCode Live Capture functionality, analysts can record the video feed and create a movie file inside the SportsCode package for the match. Recording the video feed and creating a movie file enables the software to refer back to specific coded sections of the match footage and replay the videos of specific events whenever they are selected from the timeline (i.e. show replay of the latest foul). Moreover, Analysts are able to rewind, review and re-code the footage as necessary while SportsCode continues to record the live footage into the SportsCode movie file.

The coding windows used by performance analysts to generate live statistics and video highlights during matches are prepared prior to the event. These code windows tend to follow a standardised format that is discussed and agreed with the coaching staff prior to the match. The match actions and in-play events that these code windows track would depend on the key areas of interest that a particular coach may want to have instant access to. For instance, a coach interested in closely monitoring their team’s defensive performance to make defensive adjustments may want to know the number of last third entries the opposition team has achieved so far in the game, the number of shots the team has conceded or the amount of possession given away in the team’s defensive zone. Knowing the coaches’ preferences beforehand enables a performance analyst to prepare their code window with the right level of trackers and descriptors that would provide a coach access to the right information at the right time throughout the match.

Presenting Statistics

The final part of the setup of the Performance Analysis equipment during matchday is the process required for coaches to be able to access key information in a timely and easy manner. The information generated by analysts through their live coding needs to add value to a coach’s decisions by being delivered at the right instances of the match to be able to influence decision-making and impact the team’s performance during the game.

The coded SportsCode timelines and statistics can be presented to coaches by interconnecting the analysts’ laptops with the coaches’ laptops via a local area network (LAN). This allows to create shared files from the analysts’ laptops that can be accessed by the coaches’ ones. A simple local network can be setup by plugging each laptop to a local network router using ethernet cables. Once all laptops are connected to the router, the “host” laptop (one of the analyst’s laptops) connects to the ethernet network via System Preferences > Network. The other computers can then connect to that laptops IP address by going to Finder > Go > Connect to Server > typing the host laptop’s IP address > Connect. This way, the coaches laptops would be able to access the shareable folders from the analyst’s laptops via the private local network.

A LAN connection is often a preferred option in sporting events, especially with large crowds, as WiFi connections tend to have bandwidth limitations that can significantly delay, or completely interrupt, the transfer of large video files across the network. During match events, when speed of decisions can be critical, a fast network connection is essential for coaches to received their analysts’ outputs without any delays.

The SportsCode packages being coded by the performance analysts are saved into the shared folder in the local network. As analysts continue to code the game into the SportsCode timeline, coaches can access the latest file through their own laptops at any time. The default auto-save feature in SportsCode makes sure that the file on the shared folder is always up-to-date. SportsCode’s statistical windows are also opened in coaches laptops to clearly display live statistics calculated from the coded events in the timeline.

Lastly, whenever the match venue does not permit this sort of setup, performance analysts often choose to communicate with coaches via radio to inform them of the key insights they have gathered. As previously mentioned, different sports, club venues or even playing levels have different infrastructures and venue formats allow certain setups and restrict others. Regardless of the specifics of a Performance Analysis setup, the objectives across the field remain the same: providing coaches with immediate information to make quick decisions while obtaining as much video footage from the match for post-match analysis.

Computer Vision In Sport

What Is Computer Vision?

Computer Vision (CV) is a subfield of artificial intelligence and machine learning that develops techniques to train computers to interpret and understand the contents inside images. This can also be applied to videos, as a video is simply a collection of consecutive images, or ‘frames’. Computer Vision aims to replicate parts of the complexities in human vision system and visual perception by applying deep learning models to accurately detect and classify objects from the dynamic and varying physical world.

The first basic neural networks were developed around the 1950s to detect edges of simple objects and sort them into categories (i.e. circles, triangles, squares and so on). These systems were further developed to help the blind by enabling them to recognise written and typed text and characters using a method known as optical character recognition. By the 1990s, the rise of the Internet meant that unprecedented datasets of millions of images were regularly being shared and generated across the web. These extensive visual datasets enabled researchers to better train their models and develop face recognition programs that helped computers identify specific pictures inside of photos and videos.

Today, the advancements in smartphone technology, social media and their frequent use by billions of users - more than 3 billion images are shared online every day – is continuously generating even greater amounts of visual data than ever seen before. Together with the increased accessibility to large computer power and the innovations in deep learning and neural networks algorithms (i.e. the invention of convolutional neural networks), the availability of such immense amounts of images have brought invaluable opportunities for computers to learn the patterns and characteristics of these images and enhance the accuracy rates for object detection and classification. As a result, computer vision systems have surpassed the accuracy of human vision at certain detection, categorisation and reaction tasks, reaching accuracy rates of 99% in a number of their applications.

How Does Computer Vision Work?

Computer Vision is now able to perform a variety of tasks in a wide range of fields, from self-driving cars to medical diagnosis. Some of these tasks include photo classification, object detection, face recognition and searching image and video content. In order to perform these tasks, computers first need to be able to generate information from images (i.e. “see” the image). Since computers can only operate using numerical values (i.e. bits), they first need to read an image in its most raw numerical form: the matrix of its pixels. This matrix represents the brightness of each pixel in an image, from the darkest black (at value 0) to the brightest white (at value 255).

Images are a made up of thousands of pixels. These pixels are one-dimensional arrays with values from 0 to 255. One single image will contain three different matrices for the three components that represent the three primary colours: red, green and blue (RGB). By combining different brightness levels of the different primary colours (from 0 to 255), a pixel can display alternate colours to those primary ones. For example, a pixel that displays a vivid colour purple will have the values Red=128, Green=0 and Blue=128 (mixing red and blue results in purple), while a vivid yellow pixel in an image will contain values Red=255, Green=255 and Blue=0 (mixing red and green results in yellow). On the other hand, a grayscale image will only contain one single pixel matrix corresponding to the brightness of its black and white colours.

Deep learning algorithms in computer vision make use of these pixel arrays to apply statistical learning methods, such as linear regression, logistic regression, decision trees or support vector machines (SVM). By analysing the brightness values of a pixel and comparing it to its neighbouring pixels a computer vision model is able to identify edges, detect patters and eventually classify and detect objects in an image based on previously learned patterns. These methods often require the model to have already previously processed, stored values and learned patterns (i.e. to have been trained) of similar images containing the object of interest to be detected and tracked in the new, unseen image.

For example, to be able to detect a person in an image, a significantly large number of pre-labelled images of people are uploaded into the system, allowing the model to learn on its own by recognising patters in the features that make up a person. Once a new, not previously seen image is fed to that model, the computer will look for patterns in the colours, the shapes, the distances between the shapes, where objects border each other, and so on. It will then compare them to the characteristics from the images and labels it had previously identified and decide, based on probabilistic rules, whether there is a person or not in this new image. In other words, computer vision systems are able to ingest many labelled examples of a specific kind of data, extract common patterns between those examples and transform it into a mathematical equation that will help classify future pieces of information.

Sports Performance Analysis 12.png

Often, computers require images to be pre-processed prior to applying any detection and tracking models to them. Image pre-processing simplifies and enhances the image’s raw input by changing its properties, such as its brightness, colour, cropping, or reducing noise. This modifies the pixel matrices of the images in a way that a computer can better perform its expected tasks, such as removing a background in order to detect objects in the foreground. This is particularly useful in video footage, where computer vision can track moving objects using a discriminative method to distinguish between objects in the image and the background. By separating the two, it can detect all possible objects of interest for all relevant frames and use deep learning techniques to recognise the specific object to track from the ones detected.

Deep learning models are often trained to automate this process by inputting thousands of pre-processed, labelled or pre-identified images. Training of models can follow a variety of techniques, such as partitioning the images into multiple pieces to be examined separately, using edge detection to identify the edges of an object and better recognise what is in the image, use pattern detection to recognise repeated shapes, colours or other indicators, or even use feature matching to detect matching similarities in images to help classify them. Models may also use X and Y coordinates to create bounding boxes and identify everything within each box, such as a football field, an offensive player, a defensive player, a ball and so on. More than one technique is frequently used in conjunction to improve the accuracy and precision of object detection and tracking in an image or video.

The Applications Of Computer Vision In Sport

In sports, artificial intelligence was virtually unknown less than five years ago, but today deep learning and computer vision are making their way into a number of sports industry applications. Whether it is used by broadcasters to enhance spectator experience of a sport or by clubs themselves to become more competitive and achieve success, the reality is that the industry has substantially increased its adoption of these modern techniques.

Most major sports involve fast and accurate motion that can sometimes become challenging for coaches and analysts to track and analyse in great detail. This is particularly difficult in those situations when the use of wearable tracking equipment and sensors to augment data collection is not an option. In training sessions and certain matches, especially if they are untelevised, performance analyst are only able to obtain a limited number of angles of video footage. This footage is limited to providing visualisation of the player’s movement rather than detailed analysis. The data and insights obtained from the footage requires the analyst to spend numerous hours manually notating and collecting events as they replay the video. Scenarios such as this is where the application of computer vision techniques can bridge that gap between the sporting event and analytical insights by offering novel ways to gather data and obtain valuable analysis through automated systems that locate and segment each player of interest and following them over the duration of the video.

In the context of sports, footage is usually acquired through one or more cameras installed at close proximity of where the event takes place (i.e. the sidelines of a training field or the stands in a stadium during a match). The angle, positioning, hardware and other filming configurations of these cameras can vary greatly from sport to sport, event to event or even within the different cameras used for the same match or training session. This can pose a challenge for certain computer vision applications to accurately detect the precise positioning of objects or their direction of movement as they may fail to understand the varying configurations used to capture the different footage presented to them, where it is for training the models or classifying new, unseen images.

Traditionally, costly camera calibration for multi-camera tracking systems was essential ball and player tracking systems. For fixed-angle cameras, this could be done through scene calibration, where balls were rolled over the ground to account for non-planarity of the playing surface. However, broadcast cameras present additional challenges in that they often change their pan, tilt and zoom. This dynamism needed to be accounted for by using sensors on the camera mounting and lens to measure zoom and focus settings and be able to relate the raw values from the lens encoders to focal length. Gaining access to these advanced filming equipment is not often an option for most Performance Analysis departments within sporting clubs, limiting their capacity to apply advanced tracking of players.

Computer vision has partially solved these limitations. With its application of image processing, computer visions systems are now able to distinguish between the ground, players and other foreground objects. Methods such as colour-based elimination of the ground in courts with uniformly coloured surfaces allow computer vision models to detect the zones of a pitch, track moving players and identify the ball. For instance, colour-based segmentation algorithms are currently being used to detect the grass by its green colour and treat it as the background of the image or video frame, where players and objects move in front of it. Moreover, image differencing and background subtraction methods have also been used on static footage to detect the motion of the segmented foreground players against the image background.

Player Tracking

One of the key aims when applying computer vision in sports is player tracking. This involves the detection of the position of all players at a given moment in time. Player tracking is a pivotal element for coaches to help improve the performance of their teams, allowing them to instantly analyse the ways in which individual players move on the field and the overall formation of their team. Today, the most advanced applications of computer vision in sport use automated segmentation techniques to identify regions that likely to correspond to players.

The results obtained from a computer vision system can be augmented by applying machine learning and data mining techniques to the raw player tracking data. Once key elements in an image or video frame are detected, semantic information can be generated in order to create context on what actions the players are performing (i.e. ball possession, pass, run, defend and so on). These techniques can label semantic events, such as ‘a one-two pass’ in football, and be used for advanced statistical analysis of player and team performance. Suggestions can also be constructed on the optimal positions of players on the pitch and be displayed to coaches in a manner in which they can compare ideal player positioning against their actual positions in a given play. The vast opportunities created from this player tracking technology has the potential to revolutionise training and scouting for players in sports.

Data Collection

The use of action and event recognition techniques aim to localise sets of actions that a player performs in both space and time. These techniques can detect events – such as goals, penalties, near misses, and shots - during video clips by identifying visual information about the environment, such as court colour and lines on the pitch. They then use that information to classify each action into sport-specific groups by assigning them labels (i.e. shot, pass, etc.). Ultimately, action recognition and classification can be used to automatically generate performance statistics in a match or training session, such as shot types, passes or possession. It can also be applied to index videos by predefined themes based on their contents to be able to easily browsed through footage and automatically generate highlights movies.

How Is Computer Vision Used In Different Sports?

In racket and bat-and-ball sports, such as Tennis, Badminton or Cricket, computer vision has been widely used since the mid-2000s. Ball tracking systems attempt to look through each camera image available to identify all possible objects resembling the characteristics of a ball (i.e. searching for elliptical shapes in an expected size range). Once these objects have been detected, they then construct a 3D trajectory of the playing ball by linking multiple frames where the ball was detected to define the ball path across the various camera angles. The results from this system can then be used to instantly determine whether a ball has landed in or out of bounds. The system provide further analysis, such as predicting the path that a cricket ball would have taken if the batsman had not hit it.

An example of the use of computer vision in tennis can be spotted in one of the major tournaments in the sport. In 2017, Wimbledon partnered with IBM to include automated video highlights picking up key moments in the match by simply gathering data from players and fans, such as crowd noise, player movements and match data. Similarly, on the commercial side, a pocket-sized device was designed by Grégoire Gentil that called in and out in a tennis match by using computer vision to detect the speed and placement of a shot and determine whether the ball was out of bounds.

Other major invasion team sports have not been indifferent to the emergence of these new technologies. In football, FIFA certified goal line technology installations in major stadiums using a 7-camera computer vision system developed by Hawk-Eye. It uses a goal detection systems with multiple view high-speed cameras covering each goal area that detect moving objects by sorting potential objects resembling the playing ball based on area, colour and shape. With an accuracy error rate of 1.5cm and a detection speed of 1s, it enables football referees to immediately decide whether or not a ball has crossed the goal line and a goal should be awarded.

Aside from widespread implementations of computer vision, such as FIFA’s goal-line technology, other ad-hoc projects have also attempted to incorporate computer vision into football. In the 2011/2012 football season in Germany, Stemmer Imaging helped Impire develop an automatic player tracking system using two cameras in the press area of any stadium. This reduced the number of operators required to get accurate data without losing the quality of the information.

In American sports, such as the NFL, computer vision has been applied to automatically generate offensive formation labeling by classifying video footage based on the coordinates of players when tracked throughout a particular play. This application has supported coaches and analysts in the evaluation of oppositions’ patterns of play by generating a wealth of data on the most common formations employed by rival teams. Furthermore, the system has provided teams with additional information on oppositions’ tactics, such as the likelihood of passing or running out of each formation, run frequency for each side of the field, split between right guard and right end, frequency of runs up the middle, pass frequency on short routes, and average yard gains between running and passing plays.

Challenges Of Computer Vision

Despite the great potential that computer vision can bring to the world of sport and the field of performance analysis, there are still critical challenges that need to be overcome before that potential can be fully exploited. Some of these challenges relate to the fact that computer vision cannot yet fully compete with the human eye. A system that fully automates video analysis of sports by tracking and labelling players remains a challenge as optical tracking systems cannot yet cope with the varying body posture of a person during sports exercises, as well as the partial or full occlusion of players by equipment or other players during collisions or interactions. Tracking of sports players is also particularly challenging due to the fast and erratic motion, similar appearance of players in team sports, and often close interactions between players.Tracking the ball is a further challenge in team sports, where several players can occlude the ball (i.e. a ruck in Rugby Union), and it is possible that players are in possession of the ball with either their hands or between their feet.

The reason for these to continue to be a challenge within the field of AI and computer vision is that we still do not completely understand how human vision truly works. Even though the field of Biology studies the eye, the visual cortex and the brain, we are still far from fully understanding all the components of such a fundamental function of the human brain. For instance, how the influence of our memory, past experiences and inherited knowledge through billions of years of evolution impacts our perception and our ability to identify elements in our world. This lack of detailed understanding of human vision and our abstract perception makes it difficult to replicate our inherited knowledge of the world through a computer. On top of that, the external dynamism, variance and complexity of our physical world proves an extreme challenge to solve through computers that have to be thoroughly instructed on the types of objects, captured through the lens of a camera, that they must detect. Particularly when they are unable to deviate from what they have been trained to identify.

Nevertheless, the field of AI and computer vision continues its rapid development thanks to heavy investments by key players, such as Google, Intel, Amazon and many others, to continue to advance the computer power, increase datasets and develop new techniques that get closer to our human vision capabilities. Eventually, these advances will inevitably continue to make their way into the world of sport as athletes and teams aim to leverage modern technologies to improve their performance and become even more competitive. As performance analysts continue to support these athletes and coaches in objective evaluation of performance, it is without a doubt that the expansion of computer vision will eventually transform key areas of Performance Analysis in sport.

Citations and further reading:

  • Brownlee, J. (2019). A gentle introduction to computer vision. Machinery learning mastery. Link to article.

  • Dickson, B. (2019). What is Computer Vision? TechTalks. Link to article.

  • Dickson, B. (2020). What is Computer Vision? PC Mag. Link to article.

  • Kaiser, A. (2017). What is Computer Vision? Hayo. Link to article.

  • Le, J. (2018). The 5 computer vision techniques that will change how you see the world. Heart Beat. Link to article.

  • Lu, W. L., Ting, J. A., Little, J. J., & Murphy, K. P. (2013). Learning to track and identify players from broadcast sports videos. IEEE transactions on pattern analysis and machine intelligence35(7), 1704-1716. Link to paper.

  • Mihajlovic, I. (2019). Everything you ever wanted to know about Computer Vision. Towards Data Science. Link to article.

  • Monier, E., Wilhelm, P., & Rückert, U. (2009). A computer vision based tracking system for indoor team sports. In The fourth international conference on intelligent computing and information systems. Link to paper.

  • Sennaar, K. (2019). Artificial Intelligence in sports – current and future applications. Emerj. Link to article.

  • Softarex. (2019). Computer vision and machine learning in sports analytics: injury and outcome prediction. Softarex. Link to article.

  • Thomas, G., Gade, R., Moeslund, T. B., Carr, P., & Hilton, A. (2017). Computer vision for sports: Current applications and research topics. Computer Vision and Image Understanding159, 3-18. Link to paper.

What is Performance Analysis in Sport?

Since the early-2000s, the analysis of performance in sport has seen a dramatic transformation in both its methods (i.e. incorporating advanced statistical modelling and new analytical frameworks) and technologies (i.e. GPS tracking, time-lapsed notational analysis software and a large variety of tracking sensors and other tracking equipment). What started as shorthand notations with pen and paper has since evolved to advanced computerised systems and technologies that collect vast amounts of performance-related data.

The rise in lucrative financial opportunities in most major sports thanks to the ever-growing revenues from broadcasting deals and the rising global audiences have inevitably raised the stakes of winning. Consequently, sporting organisations are now turning to more scientific, evidence-based approaches when managing their institutions and developing their athletes. Standards in elite sports to achieve and maintain success are continuously being raised, placing increasing pressure on clubs, coaches and athletes to develop more efficient training structures, enhance athlete development processes and gain better understanding on the factors that determine success in major tournaments.

The highly competitive environment with constantly narrowing margins have triggered the emergence of Performance Analysis as an independent, yet interdisciplinary, backroom function that specialises on the objective, and most often quantitative, evaluation of performance. This relatively new field aims to support coaches in identifying key areas of performance requiring attention, evaluating the effectiveness of tactical and technical performance, as well as the strengths and weaknesses of upcoming oppositions. Its purpose is to provide valid, accurate and reliable information to coaches, players and any relevant stakeholders to augment their knowledge on a particular area of the sport.

Traditionally, Sports Performance Analysis has been defined as an observational analysis task that goes from data collection all the way to the delivery of feedback, and aims to improve sports performance by involving all coaches, players and analysts themselves. The observation of performance is carried out either live during the sporting event or post-competition through video footage and gathered statistics. Performance Analysts can now be spotted in stadiums, whether in the coaching box or a separate good viewing location within the stands, notating events and actions from the match using specialised software, such as SportsCode, Dartfish or Nacsport. In this process, they develop statistical reports that can be sent in real-time to the devices used by coaches (i.e. iPhones or iPads) and display to them a summary of key performance metrics, as well as short video feeds of key highlights. However, the additional time available in post-match analysis allows for a more detailed evaluation of performance using additional complementary sources of data. The data used during post-match analysis can come from sources beyond the analyst’s observations, such as qualitative data, video sequences and even measurements athletes’ exertion, heart rate, blood lactate levels, acceleration, speed and location metrics collected through wearable devices. Some of these data will often be sourced internally within the club but external sources, such as that of data provides like Opta, are often utilised across multiple sports to complement internal databases. Training sessions are also subject to analysis, with continuous monitoring of players to inform debriefing sessions by coaches and help plan the next session.

Research in the field has also emerged as its own specialised field. The International Journal of Performance Analysis in Sport now regularly publishes studies on key sports analysis research areas, such as the identification of key performance indicators, injury prevention through work-rate analysis and physical analysis, movement analysis, coaches’ behaviours and feedback processes, effectiveness of technique and tactics, normative profiling, overall match analysis and even the analysis of referees’ performance.

Performance Analysis As Its Own Backroom Function

Over the last two decades, Performance Analysis has established itself in many top sporting clubs and organisations as a pivotal element in the extrinsic feedback process that coaches use to accelerate the learning process and assist athletes reach their optimal performance levels. It is now considerate its own separate function within the backroom staff of a team, having differentiated itself from other sports science disciplines its core focus on quantitative performance evaluation, yet with a high degree of cross-functional aspects requiring it to maintain a close relationship with wider sports science disciplines. For instance, a work-rate analysis performed by a Strength & Conditioning department may complement the work of a Performance Analyst team on informing player selection based on both performance metrics and player fitness.

The Purpose Of Performance Analysis In Sport

The large volume of quantitative and qualitative information produced from the complex and dynamic situations in sport needs to be carefully disseminated and clearly presented – using clear visuals such as tables, charts or special-purpose diagrams of the playing surface - to allow coaches to obtain quick insights on areas requiring their attention. Performance Analysis enhances the coach’s ability to ‘feed-forward’. It aims to anticipate an opposition’s strengths and weaknesses by performing thorough opposition analysis to produce acquired knowledge that allows the team to rehearse appropriate plays and improve those individual skills that would aid to outperform the upcoming opponent.

The insights generated through Performance Analysis work such as opposition analysis help coaches make informed decisions on tactical choices and squad selection that would better exploit the weaknesses and overcome the strengths of a given opponent. Traditionally, these decisions were made in its entirety following a coach’s acquired wisdom through years of experience in the sport, often having previously played at elite levels themselves. However, studies have repeatedly proven that coach recall capacity of critical incidents that take place in a sporting event is limited to between 42% and 59% of events. On top of that, the events that are remembered are prone to incompleteness, emotional bias, inaccuracy and misinterpretation due to the natural flaws in human perception and cognitive capacity. Cover for these limitations in an increasingly more competitive environment coaches have turned to technology and analytics to have immediate access to both objective information of past events as well as instant video footage to review specific events they wish to recall and re-evaluate. For this, most top-level coaches now benefit from their own Performance Analysts departments that provide them with the necessary data collection, data manipulation, analytical and video analysis skills to allow them to take advantage of the vast amounts of information generated from their sport, yet receive those key elements most important to them in a clear, timely and concise manner.

The Scope Of Performance Analysis In Sport

Technical Analysis

The development of better athletes, from elite levels to grassroots programs, has been a key focus of the field of Performance Analysis in Sports over recent years. The mechanical detail of skills performed by athletes are carefully analysed to detect flaws in technique, monitor progress and identify changes during preparation or even assess rehabilitation from injury. The effectiveness in which an athlete performs specific skills or a broader passage of play is measured, compared and classified, either positively or negatively, against a predetermined expected outcome. For example, a coach may expect a minimum passing completion rate from its midfielders or a minimum speed from its wingers in football. Often, these measurements are presented as ratios or percentages of successfully performed skills, such as the percentage pass completion or tackling success. They are then used to develop performance profiles of players that are used to benchmark and compare them against teammates or rival players.

Tactical Analysis

Similarly, tactical analysis carried out by Performance Analysts help coaches better understand the impact of their tactical decisions. It can also help identify specific tendencies and preferred tactical setups by opposing teams. By leveraging the latest video analysis and player tracking technologies, Performance Analysts are now increasingly more capable of evaluating patterns of play in conjunction with skills performed, location on the field, timings and players involved to draw an accurate representation of tactical variances given particular match scenarios.

Physiological Analysis

Player movements are also carefully assessed to ensure they achieve positions of advantage, as well as desired velocities, distance covered and speed ranges. This line of work by Performance Analysts is closely complemented with the work by a Strength & Conditioning team. The aim is to enable the athlete to achieve their optimal physical condition by providing performance analysis on areas relating their strength, power, endurance, agility, stability and mobility. Injury prevention is also a priority, especially in sports with intense physical contact where likelihood of injury is high. GPS trackers and other wearable technologies are combined with video analysis to understand the physical efforts that players go through during training and matches and allow coaches to better manage the intensity of sessions.

Psychological Analysis

Psychological training is a key element of the coaching process when it comes to mentally preparing athletes to the pressures of a sport and the challenging conditions that may impact their motivations and ambitions of reaching their desired goals. Performance Analysts are able to support coaches through the evaluation of an athlete’s discipline, exertion, efforts and other fluctuations of work-rate that could be associated to mental factors it an attempt to minimise effects of negative mental influences and positively influence athletes. Most often, Performance Analysts use their video analysis abilities to create motivational clips and video highlights that can support coaches with the mental preparation of their teams and athletes.

Equipment And Technologies In Performance Analysis In Sport

Today, most Performance Analysis departments at elite clubs start their analytical process by recording video footage of training sessions and competitive events. Often, more than one HD camcorder is set up at high viewpoints on the sidelines of training pitches or stadiums to collect footage in various angles, whether is at a closer angle capturing just a few players or a wider angle of the full sections of the pitch. In some instances, drones are also used to capture an even wider angle from above the players on the pitch to be able to clearly identify gaps during plays or structural setups and formations. Certain actions during training sessions may also allow for the Performance Analyst to get physically closer to the play and use a handheld camera, such as a GoPro, to capture an additional angle that shows closer movements and player technique. The footage from the camcorders is captured into SD cards inside the cameras or directly into a laptop using media management software, such as Media Express from BlackMagic Design. Often both are used in conjunction to act as a backup of each other. Alternatively, Performance Analysts may also obtain video feeds for certain matches or competitive events that are broadcasted from the broadcasters themselves, freeing up their time to perform additional real-time data collection and analysis during the event.

Once the video footage is gathered, Performance Analysts leverage the capabilities of time-lapsed computerised video analysis software, such as SportsCode, Dartfish or Nacsport, to notate key events and actions and generated meaningful data for later analysis. These solutions allows them to replay the training session or match and tag key events to construct a database with frequency counts, length of specific actions and supportive contextual information of each individual action (i.e. whether a tackle was successful or a missed opportunity). Coaches and players can later go through the coded timeline of the event and view specific video highlights automatically generated by the software. Analysts would then export the frequency data into data manipulation and analysis software, often being Microsoft Excel, and perform further analysis on the data and combine it with historical datasets, data from wearable tracking devices - often players wear GPS trackers, such as Catapult, StatSports or Playertek - or even data obtained from external sources and data providers, such as Opta.

The insights generated from the analysis are then delivered to the interested parties, coaches or players. The method of delivery varies greatly from club to club and depends greatly on the audience receiving the information. Summary reports may be printed and distributed amongst players and coaches with key statistics and areas requiring attention. In other occasions, data visualisation software such as Tableau may be used to interactively display charts and other visuals of team and player performance. Most often, coaches and players get a great deal of value from watching replays and highlights of the areas being analysed. Therefore, analysts often create short highlights clips using video editing tools, such as CoachPaint, KlipDraw, Adobe After Effects or Premiere Pro, or simply Apple’s iMovie application, to produce a combination of notated footage that clearly displays the information they want to portray to the coaching staff and team.

What Is Next For Performance Analysis In Sport?

As technology continues to evolve and data-related solutions increasingly bring new functionality to the field, the field of Performance Analysis will continue to grow. New technologies will bring new opportunities for sporting organisations to become even more competitive and better maximise their athlete’s potential. Inevitably, as a club’s main goal is to outperform and outsmart its competitors, this will continue to raise the standards of success in all major sports, where investment in solutions and human resources that allow them to exploit these new opportunities will continue to increase overtime, given that the financial incentives of winning will remain lucratively attractive to owners and investors.

However, further advances in technology and the sophistication of processes will also bring new complexities to the environment that Performance Analysts will operate in. This will place additional pressures to the skills demanded in the field, where not only a good acumen of a sport and coaching processes will be needed, but also highly technical skills to effectively navigate a growing data ecosystem will be essential. Inevitably, some of the current manual and repetitive tasks will be automated using modern solutions. For instance, analysts often make use of video analysis software to manually code every single event as it takes place in the footage. However, computer vision could eventually replace these repetitive and labour-intensive tasks during data collection from video footage by automatically detecting and tracking players and moving objects (i.e. the ball) in the field and performing frequency counts using pre-programmed functions. This automation enable clubs to free-up resources from the Performance Analysis departments and allow analysts to reallocate their time into generating insights through deeper analysis of the collected data.

The field of Performance Analysis is, today, at its early stages. Different sports are at different stages in their adoption of this new and critical function inside their backroom teams. Some are not yet considering Performance Analysis a priority when hiring and developing such teams. The novelty of the field, a limited understanding of its use and benefits by owners and club decision-makers, as well as the competitive labour market, where wealthy companies from other industries are also interested in hiring individuals with an analytical and technical skillset, has challenged the consolidation of Performance Analysis in certain sports. However, not all sporting clubs and institutions have been slow at their incorporation of specialised analysis of performance. Wealthier and more established clubs have been able to experiment and appreciate the benefits of investing in the skillsets that have allowed them to better understand key factors of success and develop their athlete’s performance through acquired knowledge that has placed them above their rivals. These innovative actions taken by top-tier teams have usually had an effective trickle-down effect on the rest of clubs within a sport, where the rest of rivals follow suit in order to remain competitive. As the field continues to grow in line with technology, we will undoubtably see an exciting evolution in the composition and structures of coaching teams and sporting organisations as a whole.

Citations and useful resources:

  • Laird, P., & Waters, L. (2008). Eyewitness recollection of sport coaches. International Journal of Performance Analysis in Sport8(1), 76-84.

  • McGarry, T., O'Donoghue, P., & de Eira Sampaio, A. J. (Eds.). (2013). Routledge handbook of sports performance analysis. Routledge.

  • O'Donoghue, P. (2009). Research methods for sports performance analysis. Routledge.

  • O'Donoghue, P. (2014). An introduction to performance analysis of sport. Routledge.

The Increasing Presence Of Data Analytics In Golf

Dating back to the 15th century, golf is one of the most traditional sports in the world. Even in its modern form, it continues to maintain most of its original characteristics and etiquette from centuries ago. However, golf has not been immune to the technological revolution that has seen many individual and team sports adopt the latest data technologies to optimise performance and enhance entertainment value for fans.

In today’s golf, every single aspect of the game, from a player’s swing to their round strategy and even the equipment they use is being transformed through scientific advances, data analysis, machine learning and cloud technologies. Impressively, this highly traditional sport has rapidly embraced data analytics as a means to provide a deeper understanding and enjoyment of the game. As a sport with one of the tightest of margins amongst its elite players, where one single dropped shot can cost you a tournament, golfers have turned to technology to develop an intelligent and information rich training regime and strategy to improve their chances of winning.

The Largest Golf Database By PGA Tour

One of the first developments that triggered the data revolution in golf dates back to 2003, when PGA Tour partnered with CDW to create an advanced ball-tracking system: ShotLink. The concept of ShotLink was first designed in 1983 as an electronic scorecard to catalogue historical data. However, technological advancements allowed CDW and PGA Tour to develop an improved system that aimed to break down every detail of every stroke taken by every player to facilitate the analysis of each player’s round and overall performance. The objective was not only to help players improve their game through data, but was also considered as an attempt by the Tour to help make the sport more accessible to modern players and fans.

Since its launch, ShotLink has dramatically evolved over the years to the point that it can now laser map each golf course and create a digital image of each hole to calculate exact locations and distances between any two coordinates, such as the location of all players and their distance to green. The system has been continuously upgraded in line with its increasing adoption by most of golf’s data ecosystem, through apps, devices, software and consultancy agencies available today.

One of the latest improvements PGA Tour has made to its data collection system is the installation of three fixed, high-resolution cameras that replaced the human-operated laser on every green to capture the ball in motion. Thanks to ShotLink, PGA Tour have managed to develop a database of 174 million shot attributes and 80,000 hours of video over the past 20 years in operation. But once the data had been collected, practical insights needed to be produced from the large number of individual data points gathered over the years. To make sense of such large dataset, they partnered with Microsoft to leverage artificial intelligence through Azure cloud-based services and create a Content Relevancy Engine (CRE) that processed ShotLink’s immense database to find the most relevant, most interesting stats that are contextual.

Today, ShotLink is used in 93 events per year. Its data feeds are accessed by broadcasters as well as top-flight players, who use the statistics from the system to analyse, compare their performance against competitors and improve their play. But not only players have benefited from the introduction of this high-tech system. Through ShotLink, PGA has managed to enhance viewers entertainment experience when watching the sport by making the ball highly visible through television.

The statistics captured through ShotLink have also been turned into into eye-opening insights that have increased the level of engagement from most golf fans. By having unprecedented data available for analysis, PGA Tour was able to uncover valuable insights relating to the different patterns of play amongst top PGA players. Some of these interesting insights included:

  • Winning players tend to make a higher number of putts between 11 and 20 feet away.

  • A third of all putts are over 20 feet of distance, with better golfers often leaving themselves 3 feet or closer on the first putt.

  • 99% of PGA players make puts within 3 feet distance.

  • Top golfers rarely go three-putt or over.

  • Hitting the fairway means the PGA golfer will under par on the hole.

  • Top players average under par after hitting the rough, which adds 0.25 of a shot to the hole.

  • The most frequent approach shot distance range is 150-175 yards. From there, 71% of PGA golfers hit the green from the fairway; but need to be between 75-100 yards to hit 71% from the rough.

  • Golfers gain shot advantage instead of losing it if they aim 25, 30 or 35 yards back to avoid the rough or other hazards.

  • Golfers should always aim for the green instead of laying-up on a par 5 that has no water or hazards around the green. This allows them to hit their third shot from within 50 yards of the hole, increasing their chances of cutting their putting distance and error rates in half.

  • An improvement of a half-stroke per round increases a player’s earning potential by 73 percent.

Development Of Data Gathering Systems, Devices And Smart Equipment

The technological revolution in golf has brought new devices and systems that can now provide statistical analysis to enhance training, playing and viewing experience of the sport.

One of the most crucial and difficult aspects of golf is the swing. It is considered one of the most complex sequence of movements in any sport, with muscle groups of the whole body involved to provide the millimetric, biomechanical prerequisites to transfer the swing energy efficiently and accurately to the golf ball. Therefore, it is not surprising that swing sensors, grip guides, shot trackers, laser rangefinders, and even virtual caddies, that help inform and improve the swing in varying circumstances have increasingly become more predominant amongst professional and amateur golfers to help them achieve the perfect swing.

Some of these devices include systems like TrackMan or K-Motion, which monitor granular variations in motion using a combination of HD cameras and microwave transmissions that reflect back from a moving golf club and golf ball and capture data of what happens at the exact moment of contact with the ball. Others, such as inertial sensors and depth cameras for 3D analysis like Golf Integrated, have been used to evaluate the swing of golfers in relation to their joint length and initial posture. These systems are able to display many factors of the golfer’s swing, such as club head launch speed, distance carried and ball spin. With the captured movement, they provide expert interpretative biomechanical reporting on body, arm, hand and club motions, as well as balance and weight distribution, during each golf swing.

Additionally, systems that use highspeed, high-resolution cameras, such as Foresight Sports’ GC2 Smart Camera System, are also able to measure club performance and ball launch data, such as ball speed, total spin, launch angle, deviation angle and spin tilt axis, to determine the ball trajectory, peak height, angle, distance in relation to initial launch condition and total final distance including bounce and roll. In combination with Foresight Sports’ HMT Head Measurement Technology, Foresight’s Sports’ devices can measure the delivery of the club head in terms of path, face plane, closure rate, velocity and impact location of the golf ball. All these data points are intuitively displayed in Foresight Sports’ Performance Fitting app using illustrated depictions of ball flight and club head data.

Traditional golf equipment is also experiencing significant change with the incorporation of analytics and technology into its manufacturing. Cobra Golf’s KING F8 club lines developed clubs with connected smart grips powered by an embedded Arccos computer sensor that tracks and analyses a golfer’s performance through shot tracking, distance calculation and location. These clubs come with their own smartphone app that uses GPS to track positioning and displays multiple analytics on the golfer’s performance, such as strokes gained and handicap breakdowns for driving, approach, chipping, sand and putting. Golf balls are also getting smarter. Coach Labs’ GEN i1 and i2 smart golf ball and OnCore’s Genious Ball now contain nine-axis sensor and on-board MCU that acts like a miniature launch monitor to measure initial direction, speed, impact force and ball rotation during putting and direction, spin rate, distance and speed in full swing and transmits the data to a smartphone app.

Amateur players have also seen their golfing experience expand thanks to technology. For instance, recreational players can now enhance their playing skills and enjoyment of the game through systems such as virtual caddies. Arccos Golf developed an Arccos Caddie solution that uses wireless club mounted sensors that attach directly to the player’s golf clubs, as well as using GPS trackers from smartphones, to collect player performance data in real time. The system can track which clubs the player uses, where they hit the ball and how many shots it took to complete each hole, broken down into driving, approach, chipping, sand, and putting. Arccos Caddie uses Microsoft’s Azure Machine Learning to leverage artificial intelligence against the 120 million shot data and 368 million geotagged data stored in its system from 40,000 golf courses to provide golfers with specific advice on how far to hit each shot, which club to use and how to make corrections as they play their round. It also offers golfers their optimal strategy off the tee after considering their likely shot distance as impacted by wind, weather, elevation and other factors. It can also calculate for them their expected score and odds of making par, their likelihood of hitting the fairway, and their chances of missing to either side. For example, it can detect a player’s tendency to miss fairways to the left with the 3-wood, or even a glaring inability to hit the green with the 8-iron.

Generating Valuable Information By Contextualising The Data Collected

Sensors, GPS, cameras and other tracking devices are unable to paint a complete picture of a player’s performance without the underlying analytics to tell the story. Even though increasing amounts of raw data points, such as swing speed, can now be captured with these new devices, analytics is pivotal to generate value and context from such vast data.

In 2017, GolfTEC tested 13,000 pro golfers and amateurs across 48 different body motions per swing using motion sensors, cameras and monitors in a study the labelled as SwingTRU Motion Study. The study aimed to define what makes a great golfer. They found that the difference between a competent golfer and a top one can be summarised in their hip sway and shoulder tilt at the top of the swing and then point of impact, as well as the hip turn at the point of impact and the shoulder bend at the finish of the swing. By statistically correlating these factors to better performance, GolfTEC developed a benchmark in which golfers can compare themselves in these different areas and make improvements.

Moreover, USGA is making use of its database of 2 million golfers and 50 million scores collected through the Golfer Handicap Information Network by developing an algorithm that creates a professional-style benchmarking ability at the recreational level to allow golfers at all levels to compare their game against others and gain insight into how they are playing. For example, this system enables amateur golfers to compare their Saturday’s round on a relative basis among the 150 others who played the same course that day.

Furthermore, there are numerous in-depth golf analytics websites, such as GOLFstats.com or the official PGA Tour website, that have emerged to take advantage of the technological wave in golf and provide data accessibility. These websites provide fans and players access to vast amounts statistics on professional golfers and tournaments at an incredible level of granularity (i.e. their longest driving average or the number of fairway hits). Additionally, the Canadian site DataGolf.org has made available a live statistical model that displays the probabilities of every player’s winning changes for every PGA Tour and PGA European Tour as they happen. By mid-2018, their predictive model was outperforming most major betting companies. They present their data through outstanding data charts and other visualisations, including historical numbers dating back to 1990.

Other websites and mobile apps, such as ShotByShot.com, Arccos 360, Anova or Golfmetrics, have also started to leverage the use of advance analytics to improve amateur golfers’ game. Any player can now have access to the right tools that allow them to easily and accurately track different data points of their game, from driving, approach shots, sand shots to putting. These apps statistically break down a player’s game to help them identify the areas that most significantly improve their overall performance. They aim to accurately pinpoint a player’s strengths and weaknesses in driving, approach shots, short game and putting, and in more detailed subcategories using the strokes gained metric popularised by Mark Broadie. Through these apps, a player would enter their scores in the app, which in return will calculate their strokes gained values and compare them against golfers at various levels. The website or app will record and analyse the player’s data, determine the relative handicaps of their game and then identify the highest improvement priority and contributing factors to improve their game.

Data Analytics Agencies Are Supporting Golfers Make Sense Of Their Performance Data

Performance Analysis agencies and consultancies, such as Golf Data Lab or TeeBox Golf, have started to emerge in professional golf. These agencies often provide golfers with tailored technical support and produce objective analysis of their game to identify trends and assess strengths and weaknesses. Teams of analysts record a golfer’s round and provide them, or their caddy, a detailed breakdown of their performance with comparisons against previous rounds and other competitors. Some of the statistics collected and analysed by these agencies include:

  • Driving accuracy to fairway

  • Par 3, 4 and 5 accuracy analysis

  • Long, medium and short iron approaches

  • Short game analysis (<50 yards)

  • Putting analysis (including data such as conversion per distance, 3 putt frequencies, tap-in rates and missed putts analysis)

  • Clubs used and club efficiency

  • Shots type

  • Dropped shots analysis

  • Comparisons with PGA averages

  • Drive versus approach analysis

  • Strike quality examination

  • Directional tendencies

Consultancies like 15th Club, an unofficial stats partner for the 2016 European Ryder Cup team, have now established themselves as key influencers in the European game, from informing qualification process and captain’s picks to the partnerships and singles order. Through their valuable application of data intelligence, they have become another crucial voice in preparing every member of the European Tour and defining their training structures. They now work with over 40 professional golfers, who have seen an average increased in earning of $600,000 by simply improving their stroke by +0.15-0.25 per round. Similar to ShotLink in America, 15th Club uses GPS, lasers and cameras operated by a group of people to collect all the necessary data points to build their algorithms and models. Additionally, they offer a visualisation platform, Waggle, for players to access their performance data. Some of the statistics available in Waggle include strokes gained against the field, top three and bottom three strokes as well as other traditional stats.

New science-based and statistical data-driven golf training centres, such as Every Ball Counts, have been recently established to help elite pros and serious amateur golfers through demanding physical and mental training sessions. Aside from leveraging various of the technologies previously mentioned, Every Ball Counts also developed an algorithm with Harvard University that takes a player’s ShotLink data and looks at 900 data points calculates 19 different metrics to formulate a game plan on how to improve a golfer’s game.

New Metrics Are Leaving Traditional Statistics Behind

One of the most popularised metrics that has appeared from the analytics revolution in golf in recent years is strokes gained. The strokes gained metric was developed in 2011 by Mark Broadie, writer of the 2014 best seller Every Shot Counts, as an attempt to modernise more traditional golfing stats previously employed, such as driving distance or putts per round. One of the issues with traditional statistics that Broadie discovered was relating to the counting of the number of putts per round. This conventional metric did not take into account the distance of each putt. In other words, players who hit their approach shots closer to the hole may have fewer putts per green in regulation than a player who is a superior putter but doesn’t hit his approach shots as close. Instead, strokes gained adjusts for the initial distance of the putt and other relevant factors to illustrate a more accurate representation of the golfer’s skill level.

To calculate strokes gained, an analysis was performed on ShotLink’s database composed of 15 million shots from players across every PGA tournament to determine the value of each shot by benchmarking it to the average of historical shots with those similar characteristics. It is a model that predicts the probability of a golfer’s score for each hole on a shot-by-shot basis. Mark Broadie applied mathematical techniques of simulation to analyse different strategies using different clubs and targets off the tee. He simulated thousands of shots and played the hole thousands of times using different strategies to identify the most effective one. He also applied dynamic programming by optimising the sequence of play in a hole and coming up with the best strategy on the tee by working backwards off the green to determine what should be the target on the first shot.

Since its development, strokes gained has allowed golfers to better understand where they gain or lose ground. Mark Broadie started discovering aspects of the game that contradicted common beliefs. For example, he found that putting is only 15 percent of the shots difference between better players and average players, with the biggest difference actually being in ball striking, especially the number of penalised shots that those with high handicaps hit. In essence, long game is the separator between the best pros and average pros, since it explains about two-thirds of the scoring differences. Putting at 27 feet or 30 feet distance on the green does not matter as much as a shot in the bunker or the shot that lands on the green instead of the rough. The distribution of the importance of each type of shot that Broadie found suggested that approach shots accounted for 40% of the players’ scoring advantage, while driving was responsible for 28%, short game for 17% and putting covered the remaining 15%.

Data Analytics In Course Management

Aside from the direct benefits to a golfer’s play, courses all around the world have also made use of technology to improve their grounds. Data systems are allowing golf clubs to track every single shot played on their course in relation to handicap, age, gender, weather conditions, pace of play, tee usage and pin locations and provide them a detailed understanding of the interaction between players and the various features of their golf course. The aim is to efficiently improve golfer experience by increasing playability, course strategy or difficulty, environmental impact or pace of play, while reducing maintenance costs through reductions in redundant water, chemical and fertiliser usage, green, fairway, tee sizes and bunker volume and size in areas of little to no play. Companies like Golf Course Architecture are also providing golf-course operators with smartwatches that are worn by members to track every shot hit and its location, while golfers get all their statistics in real-time as they play.

How Are Pro Tour Golfers Applying Data To Their Play?

In recent years, a new generation of professional players have employed statisticians and data analysts to analyse the vast amounts data available and identify their strengths and weaknesses against those of their opponents in order to improve their performance and define winning strategies. One of these golfers is Rory McIlroy, who has made heavy use of the 32,000 data points per event that ShotLink System captures to benchmark himself against everyone else, particularly using statistics such as strokes gained.

In 2012, Dustin Johnson found immediate results when discovering through data analysis that he ranked 166 in wedge game. After identifying his specific area of weakness and fine-tuning his wedges using a high-tech Trackman device to monitor and improve the accuracy of his short game, he managed to improve his approach shots from 50-to-125 yards. By 2016, he had become fourth in the ranking.

Other golfers like Brandt Snedeker also embraced technology as early as 2011, when he became the first tour player to hire a full-time analyst. By 2015, using radar technology to track swing, he determined that his best swing launched the ball at 12 degrees with a spin rate of 2,400 revolutions per minute. He then used this information as a baseline when testing and acquiring new equipment that incorporated the latest advances in design and verify whether it improved his performance.

Other examples include Danny Willett, when in 2016 he made use of 15th Club to gain access to a team of golf professionals, data experts and software engineers who analysed ball locations at Augusta National and helped him plot his winning strategy during the 2016 Masters Tournament. The strategy consisted on taking advantage of Willet’s great wedge game between 75 to 100 yards on par 5s when his tee shots went wrong. He went on to win the tournament by making 11% of shots above par compared to the 26% field average.

Luke Donald, through his golf coach Pat Goss and the help of Mark Broadie, also rose through the ranks by taking advantage of analytics and the strokes gained formula to understand where to improve and inform the design of practices to improve specific statistics. These statistics showed Goss that even though Donald did not drive the ball far, he was very good at short game and putting. It allowed him to define a winning strategy where Luke Donald had to get almost a full shot in putting and the rest from the short game inside 100 yards and from iron play, and just break even with driving.

Today, data analysts in golf are becoming as important to tour pros as swing instructors and fitness trainers. They parse statistics to create better training plans and arm the golfers with game plans for each week. As data gets more complex and margins tighter, data analytics and the integration of technology in the sport will continue to rise and gain in importance. Golfers seem to have understood and accepted that and appear to be embracing the ever-growing technological revolution in sport.

Citations:

  • Chansanchai, A. (2018). PGA TOUR launches a new solution that gives golf fans more personalized content experiences. Microsoft News. Link to article.

  • Cloke, H. (2019). Data-driven design. Golf Course Architecture. Link to article.

  • Corcoran, M. (2019). Wise guys: Data Golf is taking analytics to a whole new level (pay attention, gamblers). Golf.com. Link to article.

  • Dusek, D. (2018). By the numbers: Analytics become an increasingly important part of golf. Golf Week Digital Edition. Link to article.

  • Greenberg, N. (2018). PGA Tour is embracing artificial intelligence, and it could change how you watch golf. The Washington Post. Link to article.

  • Kramer, S. (2018). This Is How Technology Meets Golf. Forbes. Link to article.

  • Lisota, K. (2016). How Dustin Johnson used data and analytics to become one of the best golfers in the world. Geekwire. Link to article.

  • Martin, S. (2015). Q&A with the godfather of golf analytics. PGA Tour Online. Link to article.

  • Morgan, T. (2016). Data analytics in golf: How a revolution in preparation is changing the sport. International Business Times, Sport, Golf. Link to article.

  • Ray, S. (2017). Don’t let the pencils fool you: Golfers are teeing up a tech revolution. Microsoft News. Link to article.

  • Schupak, A. (2017). Pro Golfers Find Winning Rounds From Numbers Crunching. The New York Times. Link to article.

  • Tour Insider. (2019). The World Of Golf Analytics. Tour Insider Today’s Golf. Link to article.

  • Wacker, B. (2019). Why a little stat analysis goes a long way on the PGA Tour. Golf Digest, Golf World. Link to article.

  • Wooden, A. (2019). The Secret To The Perfect Golf Swing Is Hidden In The Numbers. Intel Technology Cloud Analytics Hub. Link to article.

  • Woodie, A. (2017). Optimize Your Golf Game with Advanced Analytics. Datanami. Link to article.

  • Wong, W. (2015). Golf Gets into the Swing of Analytics. BizTech Business Intelligence. Link to article.

Impact of Data Analysis And Technology in Rugby Union

In August 1995, the International Rugby Board declared Rugby Union a professional sport. As we approach the 25th anniversary of the professionalisation of Rugby Union, it is worth reflecting back on the evolution of the sports during the last two and a half decades. The sport has experienced incredible change, with multi-billion worldwide audiences, broadcasting agreements and lucrative contracts for players, coaches and clubs. This rise in popularity led to the rise of the standards to performance demanded at an elite level. Competitive margins became tighter as athlete development, the coaching processes and overall club management became more complex. Incentives of winning to attract sponsors and broadcasters became a major focus and so did the efforts of clubs to acquire an extra competitive edge over their opponents. This added complexity triggered the emergence of new backroom functions that dealt with areas from physiological, psychological or biomechanical aspects affecting players (i.e. Strength & Conditioning coaches or Team Psychologists) to those providing an objective evaluation of performance and addressing the need of a better understanding of the determinants of success in the game (i.e. Performance Analysts).

Emergence of the Use of Technology and Data

Over the years, advancements in technology and data management processes in all top sports have led the way in better defining individual and team performances, and Rugby Union is no exception. Coaches and other backroom staff can now be seen in the stands with a wide variety of computers and technology monitoring all aspects of the match in great detail. Different camera angles, data and analysis are now available to them right there and then to make instant decisions, as well as post-match reviews.

Sports Performance Analysis in Rugby

VIDEO ANALYSIS TECHNOLOGY

Amongst the many new practices emerging from the use of technology, the introduction of video analysis in the coaching process has enabled for dynamic and complex situations in sports to be quantified in an objective, reliable and valid manner. Time-lapsed software packages like SportsCode have enabled Performance Analysts to analyse match or training footage by manually tracking event frequencies and creating datasets for later analysis. Thanks to SportsCode and other videoanalysis software, these datasets are also linked to video footage for better contextualisation during review.

RESHAPING BACKROOM STAFF PROFILES

The ways in which the collected data is used is also evolving from basic visualisations, historicals and dashboards to more complex prescriptive approaches that provide more informed recommendations and can predict possible outcomes. This change is being driven by a new generation of Sport Scientists and Performance Analysts who have come into rugby with an increasingly stronger background in data and analytics. With the hand of coaches willing to listen to data, they are changing the culture within clubs into a more evidence-based approach to performance. These analysts not only analyse all aspects of their team’s performance but also aim to detect the strengths and weaknesses of their next opposition for coaches to use in their game plan. Thanks to the latest technologies and availability of data through third party providers like Opta, they can now perform incredibly detailed analysis, such as an opponent’s key player’s kicking game (i.e. the types of kicks, when he made them, from which part of the field and the distance he tended to get) or even identifying who are the key players in an opposition’s running game.

IMPROVED TRACKING EQUIPMENT AND DEVICES

In today’s modern rugby, all leading rugby union clubs use data to monitor fitness, prevent injuries and track player’s positions through devices such as wearable GPS trackers. The data captured from these technologies have played a key role in preventing player injuries. GPS technology company Catapult - which develops wearable devices sewn into the back of players’ shirts - recently aimed to deepen the use of data in rugby by launching a unique set of algorithms engineered to quantify key technical and physical demands in the sport. They achieve this by automatically detecting scrums, kicks and contact involvements in Rugby Union players. This data providing insights on the physical demands imposed to players gives coaches crucial information to manage the load given to players during training and matches to better maintain adequate levels of fitness while preventing injuries from physical overexertion. Coaching staff can now see the levels of effort put in during training sessions and, by monitoring the players’ thresholds, they can better design training sessions to keep the players fresh for the games. One of the benefits from Catapult’s Rugby Suite is the measurement of contact involvement duration (i.e. the time a player takes to get back to feet, also known as Back In Game Time). This allows strength & conditioning coaches to identify player fatigue levels and their intent when returning to the defensive or offensive line.

Source: Business Insider - Credit: Harlequins/Catapult

Source: Business Insider - Credit: Harlequins/Catapult

INNOVATIVE TECHNOLOGY TO ENSURE PLAYER WELLBEING

Another key area strongly impacted by technology is concussions. Concussions are a growing issue in the sport, leading to players eventually suffering from chronic traumatic encephalopathy, a degenerative brain condition with symptoms similar to Alzheimer’s. This has been a focus of technological developments aiming to better prevent and monitor them across various contact sports. Historically, pitch-side doctors rely on player honesty for their risk assessment when deciding whether the player should return to play. However, companies like OPRO+ are now building impact sensors into the personalised gumshields frequently worn by players to protect their teeth. By having impact detection technology closer to the centre of the skull doctors can paint a more accurate picture of the forces involved in each impact. OPRO+ can transmit impact data to a laptop in real-time so that pitch-side doctors can assess whether a player requires further assessment. This has proven particularly important in training sessions, where 20% of head injuries take place, although most of them go unseen. Thanks to this technology, coaches are now able to assess the forces exerted by players during drills and adjust the practice accordingly to avoid undetected head injuries. This type of tracking technology could eventually help develop a digital passport of historical head impact data for individual players, which can help them lengthen their careers by preventing early retirement due to poorly treated head injuries.

Further advancements in the use of technology to prevent concussions were introduced as recent as five years ago across the world of rugby. In 2015, World Rugby also introduced a cloud-based technology developed by CSx into the Head Injury Assessment (HIA) process. This system collected neurocognitive information that medical staff can review to determine if a player suffered a concussion. They transferred the data on the players involved, incidents and medical assessments to the data analytics platform Domo via an API, where the various datasets would be joined up in one single consolidated platform for further analysis. This new technical process introduced by World Rugby brought the estimated number of players allowed to continue to play after being concussed down from 56% to just 7%, while the chances of being removed of the game without being concussed only increased from 3% to 5%.

Source: The Times

Source: The Times

How Are Unions And Clubs Managing The Relationship With Data And Technology In The Sport?

Successful rugby unions like New Zealand Rugby have started considering the balance between data and intuition. Their performance analysis department now operates in a highly dynamic technological environment where it provides its teams the ability to quickly analyse data for performance insights. The All Blacks turned to SAS in 2013, when they adopted SAS Visual Analytics as their main reporting tool. It enabled them to obtain a formal data management process that consolidated all real-time match data, post-match data and data retrieved through third party data providers in one unified and centralised platform.

New Zealand Rugby manages the relationship between players and technology by adopting the philosophy that when it comes to match play players are considered the ones in control of the game, as they are the ones that see, hear or feel what’s happening on the field. Technology is considered a supportive tool in the background to help inform decisions by bringing context and evidence to conversations, but not take over them.

As per England Rugby Union, head coach Eddie Jones addressed the significance of data prior to travelling to the 2019 World Cup in Japan. He suggested that data has had a key role for him in seeing what is important and deciding where to invest in to build the strength of your squad. England Rugby benefits from an extensive analytics team that provides post-match analysis but also real-time tactical suggestions to coaches during matches. The department implemented a philosophy of always looking for the winning edge. For instance, they aim to discover winning trends such as the now well-established theory that the use an effective kicking game tends to lead to more successful match outcomes, a theory now considered a basic principles in the sport.

Moreover, Rugby Australia also entered the world of data analytics by partnering with Accenture to develop a bespoke high-performance unit (HPU) analytics platform using Accenture's Insights Platform (AIP) that consolidated all their data activities. The system placed sports data at the core of all team’s management processes. As data ecosystems have become more complex with numerous sources and purposes for different datasets, Rugby Australia was able to integrate data, deliver insights and enable users in a single platform that provides a smarter and more automated approach that has led to a more effective way to manage their data assets. Insights are now available to players and staff via a mobile app that provides clear visibility of a particular player’s performance and health as well as allowing deep-dive exploration into highly detailed statistics about daily performance.

The growth of data management systems and processes has also extended beyond unions. Overtime, media, consultancies, tech companies and clubs themselves are beginning to gather larger amounts of data of the game in an attempt to develop big data capabilities. For instance, Accenture and RBS developed an analytical package for the 2017 Six Nations tournament that contained six million data points per match. IBM and the RFU also performed a similar exercise by developing a predictive analytics software, TryTracker, to forecast the outcome of a game by mining data from historical rugby matches obtained from Opta.

However, when it comes to professional clubs, data is increasingly more custom-made by the clubs themselves to tailor for particular coaching philosophies and needs, as well as team-specific insights. Most clubs will receive data from third-party providers like Opta at a certain level of granularity, but will then gather their own internal data often at a much deeper level. They create their own datasets where they might even analyse the technique of every single player in the team individually. For example, teams may track a more detailed view of their defense, detailing the dominance of each tackle. Coaches can also have an input in data captured by providing their expert insights as additional data points. Analysts will incorporate the couches’ perceived effectiveness or quality of a given action by a player as categorical data variable to the dataset (i.e. positive or negative movements according to effectiveness in performing a set of moves).

Have Data and Technology Been Fully Accepted In The Sport?

In December 2019, a study by Andrew Manley and Shaun Williams from the University of Bath triggered a new debate of whether the essence of the sport (i.e. enjoyment of the players) seen during the amateur era and the early professional years has been lost. Players are, allegedly, increasingly concerned about the use of modern technology to provide clubs with greater surveillance and pressure to perform over them.

OVER-EXPOSURE THROUGH TECHNOLOGY

The qualitative study by Manley and Williams interviewed 10 professional rugby players and asks them about their experience with data and technology at their club. Like many others at an elite level, their club used a series of devices such as laptops, camcorders, GPS devices, heart rate monitors, body fat recordings, mood score sheets, iPhones/iPads and mobile apps to map, track and monitor individual performances and player wellbeing. Data from these devices was collected by analysts and matched against the team’s key performance indicators. Analysts and coaches would then assess each player’s performance and set appropriate improvement plans. Once collected and validated, the data was published in the club’s mobile app for players to access it. According to the players interviewed, the open exposure of individual statistics created a climate of fear of public embarrassment when failing to meet personal performance indicators.

A CHANGING CULTURE

The club had also developed a global Work Efficiency Index for each player that was derived from 70 different variables describing a players positive and negative actions and physical condition. The use of this new metric by the club extended all the way to contract negotiations. This raised serious concerns from players, who often failed to understand how to improve their Work Efficiency Index, thus became suspicious that the results were being manipulated to suit the management’s rhetoric at any given time. Players started to obsess over this metric, prioritising it above their individual impact to the overall team performance. On the field, they also became risk adverse to avoid negatively impacting their specific stats defined by the clubs. They feared being called-out by coaches and judged by teammates during post-match reviews. Even then, performing well in individual stats had other negative effects on team dynamics. Players with positive individual stats had incentives to take it easy and ignore the additional contribution they could bring to the team after they ticked all the boxes.

Sports Performance Analysis - Rugby 3.jpg

INVASIVENESS OF CONSTANT MONITORING

Players also found the introduction of technology to be invasive in nature. The mobile app used by their club involved continuous monitoring of their activities and sent frequent notifications and reminders to players’ phones. Some of the features of this app included the monitoring of weight management. The club had even introduced fines if players failed to meet their body weight targets set in the system. Additionally, the new machine mentality at the club had coaches increasingly turning to technology to zoom in on the deficiencies affecting individual and team performance as a response to the pressures of a growing fan-base and increasing commercial interests of owners and sponsors that demand an acceleration to title success. Players felt that the excessive use of technology had introduced a Big Brother surveillance on players and was used as a coercive method of ensuring that players meet institutional objectives. Data and technology had simply become standard practice in elite coaching of modern rugby. However, players felt that these unrelenting practices of constantly monitoring had harmful consequences to their playing and private lives, as well as relationship with coaches, which had not yet been addressed. In their interviews, they argued that technology has enable coaches to formalize a regime of power, with the risks of turning the humanistic approach of coaching into pure data engineering.

Sports Performance Analysis in Rugby 1.png

PURISTS VERSUS OBJECTIVISTS

Other critics of the use of technology argue that Rugby Union is losing its way due to data. According to them, individual wizardry and innate empathy in the sport created from the unpredictability in the game is suppressed by those digital data profiles created by analysts and coaches that players are constantly trying to meet. The researchers in the study argued that data is taking away intelligence, creativity and human connection from the sport through mechanistic and restrictive routines imposed to players. As players become more risk adverse, predictable and formulaic, a culture without instinct, emotion and unpredictability is introduced in the sport, inevitably becoming less attractive to fans. This culture, according to researchers, encourages individualism over team dynamics and incites anxiety amongst players by throwing large amounts of data at them to pressure them to perform to the stats. This has become detrimental to their enjoyment and performance in the game.

While having recently praised the significance of data in achieving success, England coach Eddie Jones also expressed his concerns regarding the production of player at grassroots levels that lacked dimension. He stated that academy players are now coached to regimentally follow a game plan rather than react to dynamic and unpredicted events in a game. They are decision followers rather than decision makers. The study claimed that the surge in technological practices, to the detriment of players and the game, has also been accelerated by the new generation of head coaches entering top division clubs. These group of coaches are former players who have only known Rugby Union as a professional sport and who feel the need to keep up with technology not to fall behind. They prioritise control over players through procedural management at the expense of educational aspects of the job.

Sports Performance Analysis - Rugby 2.jpg

DATA OWNERSHIP AND SECURITY

Data ownership has also become a key concern to players. Even prior to the launch of GDPR regulations, legal proceedings had been discussed between players and their respective clubs on this matter. Their main concern was relating data accrued by clubs and unions through GPS units, and other performance measurement devices, relating to a player’s medical history, such as injuries. They wanted to prevent clubs from using their data without their consent, or even selling it to third parties, which could have detrimental effects to their careers and future earnings. The International Rugby Player Association addressed this issue by pressing on the efforts to make personal statistical data relating to the player to be owned by the player themselves, who should also receive any benefits that may arise from the commercialisation of such data.

Player statistics may not only be used in contract negotiations by the player’s current club but also by clubs interested in incorporating them in the near future. For instance, if a player’s performance in training has statistically declined (i.e. speed tests, work-rate or lifting in the gym) that information could be valuable to a club interested in signing said player. However, the information at the club’s disposal may lack completeness and paint an imprecise picture of the player’s true value. For example, there is a lack of measurement of soft skills a player can bring to a team, such as leadership and motivational impact on the rest of his teammates. Additionally, the security of their private and confidential data stored at the club is also an area of concern. As larger amounts of complex player data is gathered and stored in the club’s systems, the risk to data breach is also increased, particularly those of phishing or hacking attacks. This means that clubs and backroom departments have to now face structural and procedural challenges relating the way they manage and secure their vast amounts of data collected and have sufficient know-how to identify and prevent any serious security gaps.

Teething Problems Of A Rapidly Growing Field

The experiences described by the players interviewed in the study reflect the eagerness in today’s big data society to make use of the ever-evolving technological advancements. Everything is turned into data in order to be objectively understood. However, one of the most important conclusions in the study is that a lot of the data used in professional Rugby Union lacked relevance. Instead of aiming to capture as many variables as technology allows, a fewer amount of data should be made available to players that is substantially more meaningful to them. That is not to say that conclusions should be drawn from insufficient data samples. Another important issue in the application of analytics in Rugby Union, particularly at an international level where fewer matches are played, has been the generation of insights from too sparse and small sample sizes that are insufficient to make predictions. Focus should be placed in collecting and analysing large enough sample of the data identified as being truly meaningful for player and team development towards achieving excellence in the game.

Sports Performance Analysis in Rugby 7.png

Practical applications should be place at the core of any consideration for using data and technology. There have been numerous studies made on different aspects of the game, but more often than not these have dubious practical applications or mere usefulness in coaching practices. For instance, a study concluding that shared experience by players within the same team is correlated to better outcomes may have minor practical applications to coaches, as it is rare or difficult to buy shared experience and there is little a coach can do in that regard. Instead, analysts should look at performance patterns and trends rather than one-dimensional statistics, such as ratios or frequency counts. For example, analytical studies should aim to identify trends that develop before tackles are missed so we can help coaches and players identify the root flaws within a team’s defensive pattern.

The use of data in the sport should advance into true rugby analytics and deep intelligence by effectively and meaningfully using the data available in the sport. Analysts should aim to fully understanding what the team is trying to achieve and then go on to identify the metrics that influence those goals. This will allow them to inform decisions that impact performance and change behaviours. Since context is key it should become the central piece of most analytical work, as without it data insights presented to coaches lack value and practicality.

Sports Performance Analysis in Rugby 8.png

The role of analytics and technology is only going to grow even further. There is increasingly new technology coming into Rugby Union. This places increasing demand on people who can process vast amounts of data and come up with relevant analysis, while at the same time not losing touch with the nature of coaching practices in the Rugby Union. While some questions can be raised about today’s appropriate use of data analysis in defining and optimizing team performance, it is without a doubt that technology has open the doors to a wide range of developments that have evolved the jobs of coaches and players. While the study by Manley and Williams exposes some concerns of how data is being applied at a club level, it is also true that player wellbeing (i.e. concussion prevention) has seen a substantial improvement with the aid of technological advancements. The idea of data analysis is not to replace all other aspects of the coaching practice but to combines the coaches’ experience and intuitions with video and data analysis to help inform decisions on training priorities, on team selection, on tactics, and longer term on player recruitment and player retention issues. There is an important place for technology and data in the sport, but like everything, a healthy balance needs to be established where data and intuition strongly complement each other.

Citations:

  • Barbaschow, A. (2019). New Zealand All Blacks balances data analytics with 'living in moment' of match. ZD Net Online. Link to article.

  • Braue, D. (2018). Rugby Australia taps big data to improve player performance. IT News Online. Link to article.

  • Cameron, I. (2019). Rugby Union legal battle brewing as players set to fight for right to 'data'. Rugby Pass. Link to article.

  • Carter, C. (2015). 27 August 1995: Rugby Union turns professional. Money Week Online. Link to article.

  • Creasey, S. (2013). Rugby Football Union uses IBM predictive analytics for Six Nations. ComputerWeekly.com. Link to article.

  • Dawson, A. (2017). How GPS, drones, and apps are revolutionizing rugby. Business Insider Online. Link to article.

  • Gerrard, B. (2015). Rugby Union analytics – five ways data is changing the sport. The Guardian Online. Link to article.

  • James, S. (2015). Statistics and data analysis are important in rugby team selection, but nothing beats personal opinion. The Telegraph Online. Link to article.

  • Katwala, A. (2019). Smart gumshields are monitoring rugby concussions. Wired Online. Link to article.

  • Leadbeater, S. (2019). How Big Data & Artificial Intelligence are having a positive impact in the sport of Rugby Union. Think Big Business Online. Link to article.

  • Macaulay, P. (2019). World Rugby turns to data analytics to tackle concussion risk. Computer World Online. Link to article.

  • Manley, A. & Williams, S. (2019). ‘We’re not run on Numbers, We’re People, We’re Emotional People’: Exploring the experiences and lived consequences of emerging technologies, organizational surveillance and control among elite professionals. Organization, 1-22. Link to study.

  • Rees, P. (2020). Is rugby union losing its way by becoming a numbers game? The Guardian Online. Sports: Rugby Union. Link to article.

  • Rees, P. (2020.) Body fat recordings and mood scores: has technology gone too far in rugby?. The Guardian Online. Sports: Rugby Union. Link to article.

  • Streeter, J. (2019). Catapult elevates use of data with all-new Rugby Suite. Insider Sport Online. Link to article.

  • Watt, D. (2019). Five things that business leaders can learn from England Rugby. Director Online. Link to article.

Nacsport: The Most Accessible Video Analysis Software

Founded in 2008 in The Canary Islands, Spain, Nacsport is another important player in the development of videoanalysis software for performance analysis across emerging regions. Similar to SportsCode or Dartfish, Nacsports allows analysts to tag any action and build a deep understanding of what’s happening for later review. The tool works similarly to its competitor, where analysts decide which events need to be analyzed in any specific game or training situation. These event can be specific actions, players, pitch areas, or any other points of interest. Buttons are created for each event, where the analyst clicks the corresponding buttons for each of event as they occur. Each click generates a tag marking the time when they happened. When the match analyses end, Nacsport software displays all the tracked events grouped into category rows and/or chronologically on a timeline.

Nacsport enables you to analyse from up to two video feeds and a total of 5 videos at once in their most basic version of their software. It also includes unique features, such as the ability to add a video overlay on top of another one for comparison purposes, or even tagging events in real-time without the need of video footage using Nacsport Remote or Tag&View apps on a mobile phone or tablet. Nacsport allows you to create your own fully customised templates to track the actions and data you want to explore, review the key moments with a timeline and interactive data tools. You can then share these high-quality insights as presentations with notes and KlipDraw drawing tools to enhance your feedback delivery to athletes and coaches to make better decisions in the future. These clip editing and presentation features provide Analysts with the ability to incorporate text notes, ratings, image overlays, logos and even drawings to analyse actions.

In 2019 alone, Nacsport managed to sell over 4,000 licenses as the company’s impressive growth continued, particularly amongst grassroots clubs, schools, colleges and universities. The company has now an established presence in 60 countries and more than 35 different sports. During the same year, they also managed to launch over 100 new features as the company continuous to enhance their product offerings in line with the developments of new technologies and capabilities in the industry. Amongst some of these features, Nacsports video analysis software is now compatible with other video analysis tools, such as SportsCode, Dartfish, InStat, Wyscout, Synergy or STATS, in an attempt by the company to facilitate a simpler, more efficient way for clubs to manager their data in a consolidated manner and encourage a smoother transition to their tool.

Five Products At Comparatively Affordable Costs

Nacsport offers five very competent products with incredible depth for coding, annotating, highlighting, reporting, analysing and broadcasting relevant sports moments. However, their main competitive advantage over other major players in the market is their affordability. Video analysis software packages often come at exorbitant prices that have kept them out of reach for numerous elite and amateur sports teams. Nacsport has disrupted this market by producing very affordable comparative video analysis product. They want to comply with the requirements of all coaches and sports staff - no matter their level, budget, or sport - with a suite of products that is scalable depending on their evolving needs. Analysts, clubs and coaches that want to start incorporating performance analysis into their workflows can obtain a Nacsport software license from as little as £130 GBP (150 EUR) per year, all they way up to their advanced version priced at £1,025 GBP. Unlike many of its competitors, Nacsports also offers a lifetime fee of 1,700 EUR so that you do not have to worry about ongoing subscription payments overtime.

Entry Level: Nacsport Basic And Basic+

Nacsport entry-level version of their software already provides sufficient functionality for basic event analysis of sporting events and data gathering. It enables analysts to track up to 50 code buttons in Basic Plus (25 in Basic), real-time event tracking and a complete timeline with slow motion, text additions and creation of highlights movies.

These substantially affordable versions are perfect for newcomers to video analysis who can quickly pick up the software and benefit from the key features and feedback resources. It is worth mentioning that the Basic+ version enables analysts to mirror high-end processes and interact with other software and services like Opta, Wyscout, Gamebreaker and SportsCode due to the ability to import/export XML files.

Some of the key functionality for these versions include:

  • Unlimited templates with up to 50 code buttons

  • Rating events during coding (i.e. rate a shot from 1-5 as you track it)

  • Group buttons by categories

  • Tag&Go for off-footage tracking (i.e. track events in your iPad and import them to your Nacsports software later on)

  • Button formatting for a more intuitive coding exercise (i.e. different shapes)

  • Exclusive links between buttons (turn one button off when another one is active)

  • Set actions within buttons (i.e. display the current score based on event counts of goals)

  • Text notes on timeline events

  • Frame by frame, fast forwards (x6) and slow motion playback modes

  • MP4 video capture, compatible with USB Digitizer, AverMedia and Black Magic H264

  • Export videos from timeline

  • Compare up to 8 events simultaneously

  • Draw and insert images on footage (integration with KlipDraw functionality)

  • Data matrix showing event counts and export functionality in XLS

  • Export XLS and PDF reports

  • Create interactive presentations with notes and actions (i.e. display certain group of events based on buttons clicked

  • Create highlights clips with transitions, slow motion, text and logos in 1080p Full HD

  • One dashboard with unlimited charts and labels that can display results in absolute data and percentages, with the option of real time display of stats

Sports Performance Analysis - Nacsport

Professional Level: Scout+, Pro+ and Elite

These versions of Nacsport offer a huge amount of functionality. Scout+ alone already offers those key features necessary to perform the majority of processes seen in most professional setups. These advanced versions allow you to create an unlimited amount of buttons within your personalised template, open 5 separate databases of different games within the timeline, review a matrix with data from multiple databases and create independent presentation windows so you can gather clips from different games. The most advanced versions - Pro+ and Elite - include high-end live processes, such as the ability to review actions whilst you are capturing them as well as wireless connectivity amongst devices on your same network.

Some noteworthy features in the advanced packages include:

  • Unlimited buttons and templates.

  • Inactive buttons (for headers or code window design)

  • An extra layer of buttons to describe certain actions (similar to SportsCode’s code vs label buttons)

  • Two-angle display (four-angle in the Pro+ and Elite versions) in highlights video as well as additional video creation functionality, such as external audio file upload.

  • Unlimited dashboards.

  • Intergrations with other providers, such as Opta or SportsCode.

These higher-end versions of the software also offer additional advanced and exclusive features such as:

  • Panel Flows allowing you to navigate between coding windows (i.e. templates) by clicking specific buttons

  • Heatmaps for a more visually attractive display of event frequencies within areas of the pitch

  • Players Connections allowing you to specify the active players on the game and analyse performance by group of players

  • Up to 4 Analysts can simultaneously track the same match onto one consolidated report

  • Category Frequency Chart provides visuals on the fluctuations of specified events over the course of the footage

  • Data Patterns provides a click and drag interface to create visual that expose patterns in the data tracked

Live Tagging Using Nacsport Tag&View

Sports Performance Analysis - Nacsport

Tag&View is an iPad and iPhone app which allows Analysts to track events without the need of a computer. The process consists on first importing or creating personalised templates within the app during the match or training session to later link up the data gathered with a video using the Nacsport software. The tracking process is similar to that of when using laptop, with the difference that no video footage is required to track events.

Amongst many features of Nacports Tag&View, it is worth mentioning the ability to create two different types of buttons: Categories (track events) or Descriptors (add extra information to the events). These buttons are fully customisable, not only in their appearance but also their preset length when using PRE and POST times or MANUAL MODE. Buttons can also be linked to one another using Activation and Deactivation links to specify the relationship between each event (i.e. exclude possession of the home team when away team possession button is active).

Adoption Of Nacsport Amongst Elite Clubs

Nacsport software is used by some of the world’s leading teams, including Liverpool FC, Atletico de Madrid, Arsenal, the Spanish National Basketball Association, England Rugby League and Scottish Rugby Union. In 2016, two analysts at Atletico de Madrid decided to start using Nacsport on a personal level, powering their respective academy teams towards their season’s success and impressing their managers. This triggered the creation of the Department of Analysis across all academy teams at the club, focusing on Nacsports software as their core video analysis software. Since then, Analysts at Atletico have often claimed that Nacsport software has been critical to the club’s successful integration of performance analysis as a team function thanks to its easy and intuitive interface that allows anyone to become quickly proficient with it, which has empowered its adoption across the club by not only Analysts themselves but also players and coaches.

Similarly, other major clubs like Gloucester Rugby are now fully transitioning from other video analysis software to Nacsports. Gloucester Rugby currently use Nacsport as their way of editing down large video files into important events during matches or training sessions for players to easily review. Additionally, former Valencia boss Marcelino Garcia Toral is also a longstanding Nacsport user and has recently emphasized on the importance of the insights gathered from the video analysis and how it has been critical in helping him manage his squad’s performance. Other clubs like Sevilla FC have Nacsport video analysis software integrated within the entire sporting structure of the club and their analytical workflows in First and Academy teams, while others like Coventry Rugby have also extended their use of Nacsport products to Nacsport Coach Stations or Nacsport Viewer to allow coaches to review and provide live feedback to players during games and training.

It will be exciting to continue to see the growth of Nacsport within the industry and how they will maintain their attractive affordability while continuously improve their product offerings at the same speed as their competitors.

Compatibility of Nacsport:

Finally, it is worth noting that currently, Nacsports is only able to run from a Windows PC (7 or older). In order for it to be used on a Mac, Nacsports recommend using an emulation software, Parallels or BootCamp. Additionally, the complete software can be tested for free on a 30-day free trial and downloaded straight from their website.

History Of Performance Analysis: The Controversial Pioneer Charles Reep

Thorold Charles Reep was born in 1904 in the small town of Torpoint, Cornwall, on the south west of England. At the age of 24, he joined the English Royal Air Force to serve as an accountant, where he learned the necessary mathematical skills and attention to detail that he went on to employ throughout his career. During World War II, he was deployed in Germany, and would eventually be awarded the rank of Wing Commander.

Thorold Charles Reep (1904-2002) - Source: The Sun

Thorold Charles Reep (1904-2002) - Source: The Sun

From a young age, Reep was a faithful supporter of his local club Plymouth Argyle and would frequently attend matches at Home Park Stadium. However, his relocation to London after joining the Royal Air Force gave him an opportunity to attend Tottenham Hotspurs and Arsenal matches. In 1933, Arsenal’s captain Charles Jones came to Reep’s camp to talk about the analysis of wing play being used by the London club, which emphasise the objective of wide players to quickly move the ball up the pitch. The talk deeply inspired Reep, who soon became a keen enthusiast of Arsenal’s manager Herbert Chapman and his attacking style of football. This was the start of Reep’s passion for attacking football and its adoption across the country.

Arsenal FC 1933 squad including Herbert Chapman and Charles Jones - Source: Storie Di Calcio

Arsenal FC 1933 squad including Herbert Chapman and Charles Jones - Source: Storie Di Calcio

In March 1950, during a match between Swindon Town and Bristol Rovers at the County Ground, Reep became increasingly frustrated during the first half of the match by Swindon’s slow playing style and continuously inefficient scoring attempts. He took his notepad and pen out at half time and started recording some rudimentary actions, pitch positions and passing sequences with outcomes using a system that mixed symbols and notes to obtain a complete record of play. He wanted to better understand Swindon’s playing patterns and scoring performance and suggest any possible improvements needed to guarantee promotion. He ended up recording a total of 147 attacking plays by Swindon in that second half of their 1-0 win against Bristol.

Swindon Town vs Bristol Rovers 1950 Match Report - Source: Swindon Town FC

Using a simple extrapolation, Reep estimated that a full match of football would consist on an average of 280 attacking moves with an average of 2 goals scored per match. This indicated an average scoring conversion rate of only 0.71% per goal, suggesting only a small improvement was needed for a side to increase their average to 3 goals per game from just 2.

In the years that followed, Charles Reep quickly established himself as the first performance analyst in professional football, as he witnessed how the information he was collecting was being used to plan strategy and analyse team performance. He never stopped developing his theory of the game, watching and notating an average of 40 matches a season, taking him around 80 hours per match. He was often spotted recording match events from the stand at Plymouth's Home Park wearing a miner's helmet to illuminate his notebook, meticulously scribbling down play-by-play spatial data by hand.

In 1958, he attended the World Cup in Solna, near Stockholm, and produced a detailed record of the total number of goals scored, shots and possessions during the final. He wanted to provide an objective count of what took place in that match, away from opinions, biased recollections or a few single memorable events on the pitch. He produced a total of fifty pages of match drawings and feature dissection that took him over three months to complete.

Match between the domestic champions of England (Wolverhampton Wanderers) and Hungary league winners (Budapest Honved) in 1954. Stan Cullis declared his team as “champions of the world” after their 3-2 victory. This provoked a lot of criticism and i…

Match between the domestic champions of England (Wolverhampton Wanderers) and Hungary league winners (Budapest Honved) in 1954. Stan Cullis declared his team as “champions of the world” after their 3-2 victory. This provoked a lot of criticism and inspired the creation of the official European Cup the following season - Source: These Football Times

The real-time notational system Charles Reep developed took him to Brentford in 1951. Manager Jackie Gibbons offered him a part-time adviser position to help the struggling side avoid relegation from Second Division. With Reep’s help, Brentford managed to double their goals per match ratio and secure their Division spot by winning 13 of their last 14 matches.

The following season, his Royal Air Force duties moved Reep to Shropshire, near Birmingham. There he met Stan Cullis, at the time manager of the successful and exciting side Wolverhampton Wanderers. Cullis offered Charles Reep to take similar advisory responsibilities at his club to the ones he successfully undertook at Berntford. Reep not only brought with him his acquired knowledge from the analysis performed at Swindon and Brentford but also a innovative, real-time process that provided hand notations of every move of a football match, together with subsequent data transcription and analysis. As a strong believer of direct attacking football, Reep’s work only reinforced Cullis’ preestablished opinions of how the game should be played.

Stan Cullis, Wolverhampton Wanderers manager from 1948 to 1964 - Source: Solavanco

Stan Cullis, Wolverhampton Wanderers manager from 1948 to 1964 - Source: Solavanco

In his three and a half years at Wolves, Reep helped the club implement a direct, incisive style of play that consisted of very few aesthetics (i.e. skill moves) but instead took advantage of straightforward, fast wingers. Square passing by Wolves players became frowned upon by Cullis and the coaching team. During this time, the concept of Position of Maximum Advantage (POMO) began to emerge, describing the area of the opposition’s box in which crossed should be directed to in order to increase the chances of scoring. Under the Reep-Cullis partnership, Wolves achieved European success in what was then the European Champions Cup competition.

In 1955, Charles Reep retired from the Royal Air Force and was offered £750 for a one-year renewable contract by Sheffield Wednesday to work as an analyst alongside manager Eric Taylor. He ended up spending 3 years at Sheffield Wednesday, achieving promotion from Division Two in his first season at the club. On his final season at the club, his departure was triggered by the disappointing results by the team, and saw Reep point fingers at the club’s key player for refusing to buy into his long-ball playing system. During the remaining of his career, his direct involvement with clubs became a lot more sporadic. Nevertheless, he managed to help a total of twenty three managers from teams such as Wimbledon, Watford or even the Norwegian national team understand and adopt his football philosophy.

Over the years away from club roles, Charles Reep continued to investigate the relationships between passing movements, goals, games and championships, as well as the influence that random chance has on those variables. He was keen to continue to develop his theory by summarizing all his notes and records he had been collecting since 1950. During this analysis, Reep developed an interest in probability and the law of negative binomial, which he applied to his dataset. His analytical methods eventually became public after he shared his notes with News Chronicle and the magazine Match Analysis.

These publications demonstrated that Charles Reep had discovered insights of the game not previously analysed. Some of these suggested that teams usually scored on average one goal every nine shots or that half of the goals scored came from balls recovered in the last third of the pitch. One of his most famous remarks was to suggest that teams are more efficient when they reduce the time they spent passing the ball around and instead focus on lobbing the ball forward with as few number of passes as possible. He was a firm promoter of a quicker, more direct, long-ball playing style.

Reep followed a notational analysis method of dividing the pitch into four sections to identify a shooting area approximately 30 metres from the goal-line. This detailed in-event notation and post-event analysis enabled him to accurately measure the distance and trajectory of every pass. Amongst his findings, he discovered that:

  • It took 10 shots to get 1 goal

  • 50% of goals were scored from 0 or 1 passes

  • 80% of goals are scored within 3 or less passes

  • Regaining possession within the shooting area is a vital source of goal-scoring opportunities

  • 50% of goals come from breakdowns in a team’s own half of the pitch

In 1953, Reep went on to publish his statistical analysis of patterns of play in football in the Journal of the Royal Statistical Society. In his paper, he analysed 578 matches to assess the distribution of passing movements and found that 99% of all plays consisted of less than six passes, while 95% of them consisted of less than four. These findings backed Reep’s beliefs of reducing the frequency of passing and possession time by moving the ball forwards as quickly as possible. He wanted that the truth he had discovered dictated how teams play.

Manual notational analysis prior to the introduction of technology - Source: Keith Lyons

Manual notational analysis prior to the introduction of technology - Source: Keith Lyons

From his first analysis of the 1950 Swindon Town match against Bristol Rovers all the way to the mid-1990s, Charles Reep went on to notate and analyse a total of 2,200 matches. In 1973, Reep analysed England's 3-1 loss against West Germany in the 1972 European Championship to vigorously protest the “pointless sideways” passing style of play adopted by the Germans. In that match, the Germans had outplayed the English with a smooth, passing style of football that was labelled at the time as “total football”. Reep attempted to argue against the praise this new passing style of play had received across the continent by implying that it lacked the attractiveness demanded by fans as it placed goal scoring as a secondary objective in exchange for extreme elaboration of play. Instead, he pushed forward his own views regarding the use of long balls and suggested that, even though they less frequently found the aimed player, they brought unquestionable gains. He stated that, based on his analysis, the chance generation value of five long passes missed was equal to five of them made.

Swindon Town vs Bristol Rovers 1950 Programme - Source: Swindon Town FC

Swindon Town vs Bristol Rovers 1950 Programme - Source: Swindon Town FC

Most of Charles Reep’s analysis supported the effectiveness of using a direct style of football, with wingers as high up the pitch as possible waiting for long balls. This approach to the game a had significant influence in the English national team between the 1970s and 1980s, when the debate of the importance of possession had become the central topic of conversation amongst FA directors. Reep, often described as an imperious individual intolerant of criticism, argued against the need for ball possession, contrary to the philosophy backed by then FA’s technical director Allen Wade.

It was not until 1983, when Wade was replaced as technical director by his former assistant Charles Hughes – a strong believer of long ball play – that Reep’s direct football ideology became the new FA's explicit tactical philosophy of the English game. Hughes saw in Reep’s work an opportunity to redefine the outdated ideals of the amateur founders of the FA and introduce his own mandate across the whole English game. This mandate consisted on a style of play that focused on long diagonals and physicality of players. As a result, technically gifted midfielders found themselves watching how the ball flew over their heads as they struggled with overly physical challenges.

Charles Hughes, The FA’s former technical director of coaching - Source: The Times

Charles Hughes, The FA’s former technical director of coaching - Source: The Times

Controversy And Criticism

Charles Reep’s simplistic methods have been, and continue to be, critised by many football fans and analytics enthusiasts. One critic indicated that while his study assessing passing distribution showed that almost 92% of moves constituted of less than 3 passes, his dataset only contained 80% of the goals, and not 92%, from these short possessions. This contradicts Reep’s beliefs by illustrating that moves of 3 or fewer passes were in fact a less effective strategy to score goals. Additionally, it also demonstrated that Charles Reep’s argument that most goals happened after fewer than four pass movements was simply due to the fact that most movements in football (92% from his dataset) are short possessions, thus it would be understandable that most goals would be scored in that manner.

Similarly, his study did not appear to take into consideration differences in team quality. Evidence of this can be seen in that the World Cup matches he analysed, which contained double the amount of plays with seven or more passes than those he recorded from English league matches. The indication suggest that Reep missed the fact that a higher quality of the game in a higher level competition, such as the World Cup, with better players available, seemed to provide longer passing moves than in English football league matches where the average technical quality of players would be inferior. Furthermore, critics have also added that none of Reep’s analysis takes into consideration any additional factors to playing style, such as the level of exhaustion exerted on the opposition by forcing them to chase the ball around through passing.

Reep’s character and very strong preconceived notions could have prevented him from investigating alternative hypotheses that did not agree with his philosophy of direct football. He was often described as an absolutist that wanted to push his one generic winning formula. This caused most of Reep’s analysis to be ignorant of the numerous essential factors that can affect a match’s outcome. Critics have often labelled Reep’s influence on the philosophies applied to English football and coaching styles for over 30 years as “horrifying”, due the fundamental misinterpretations Reep committed throughout his work. As previously stated, one of these consisted on applying the same considerations and level of weighting to a match by an English Third Division team than to a match in the World Cup. He paid no attention to the quality of the teams involved, ignoring potentially valid assumptions that a technically poorer team may experience greater risks when attempting to play possession football. Instead, he followed his own preconceptions, such as assuming that teams should always be trying to score, when in reality teams may decide to defend their scoreline advantage by holding possession.

Aside from the criticism for his poor methods and misinterpreted finding, Reep has also been recognised for the new approaches he introduced to the analysis of the game. He was one of the first pioneers to show that football had constant and predictable patterns and that statistics give us a chance to identify what we would otherwise had missed. He initiated the thinking around the recreation of past performance through data collection, which could then inform strategies to achieve successful match outcomes. While he might not have been an outstanding data analyst, Charles Reep was a great accountant with great attention to detail and ability to collect data.

The approaches he introduced have significantly evolved since Reep’s first notational analysis in 1950. Technologies and analytical frameworks developed since the 1990s have facilitated the emergence of video analysis and data collection systems to improve athlete performance. From the foundation of Prozone in 1995 that offered high-quality video analysis to the appearance of Opta Sports or Statsbomb as global data providers capturing millions of data points per match, the field of notational and performance analysis in football has evolved in line with the technological revolution of the last few decades. The popularity of big data and the growing desire of data-driven objectivity has become important priorities within professional clubs when aiming to gain competitive advantage in a game of increasingly tight margins. Reep’s work initiated the machinery that is today an ecosystem of video analysis software, data providers, analysts, academia, data-influenced management decisions and redefined coaching processes that constitute a key piece of what modern football is today. While none of these elements can win a match on their own, they surely have been making crucial contributions in providing clubs with those smallest advantages that make the largest of differences.

Citations:

  • Instone, D. (2009). Reep: Visionary Or Detrimental Force? Spotlight On Man Whose Ideas Cullis Embraced. Wolves Heroes. Link.

  • Lyons, K. (2011). Goal Scoring in Association Football: Charles Reep. Keith Lyons Clyde Street. Link.

  • Medeiros, J. (2017). How data analytics killed the Premier League's long ball game. Wired. Link.

  • Menary, S. (2014). Maximum Opportunity; Was Charles Hughes a long-ball zealot, or pragmatist reacting to necessity? The Blizzard. The Football Quarterly. Link.

  • Pollard, R. (2002). Charles Reep (1904-2002): pioneer of notational and performance analysis in football. Journal of Sports Sciences, 20(10), 853-855. Link.

  • Pollard, R. (2019). Invalid Interpretation of Passing Sequence Data to Assess Team Performance in Football: Repairing the Tarnished Legacy of Charles Reep. The Open Sports Sciences Journal, 12, 17-21. Link.

  • Reep, C. & Benjamin, B. (1968). Skill and chance in association football. Journal of the Royal Statistical Society, 131, 581-585.

  • Sammonds, C. (2019). Charles Reep: Football Analytics’ Founding Father. How a former RAF Wing Commander set into motion football’s data revolution. Innovation Enterprise Channels. Link.

  • Sykes, J. & Paine, N. (2016). How One Man’s Bad Math Helped Ruin Decades Of English Soccer. FiveThirtyEight. Link.

SportsCode Scripting Guide

Coding windows and statistical windows in SportsCode can be substantially enhanced using scripting, from automating certain event tracking to displaying real-time statistics to creating movie highlights of players or types of plays. However, unlike most analytical software packages, SportsCode uses their own coding syntax, creating the need to learn and understand their software-specific way of writing any command. Some of these are similar to functions in Excel or Numbers, although their slight alterations make it crucial to ensure they are correctly written in order to work. This guide walks through some of the key commands that can make your coding experience in SportsCode a lot smoother.

Where To Use Scripting?

Scripting in SportsCode is done through either a Code window or a Statistical window. You can use an existing code window that you already have or create a new on in File then New then Code window.

SportsCode Code Window

The actual script is written inside a code button. You can either add a new code button or use an existing one. If what you want to do is show an output in that button, then you need to open the “Inspector” popup window for your button, select the “Appearance” tab and tick the “Show output” option. This will set the code button as a button with the function of displaying information.  To start writing a script go to the “Script Editor” tab within the Inspector window.

While not necessary, SportsCode recommends adding an “Execute” button in your Code window’s tool bar by right-clicking on the toolbar and selecting “Customize Toolbar…”. This “Execute” button is used to run the code after it is written, although the Play button of the Code window will have the same effect of running the code.

Commands To Select Elements & Events

Prior to starting writing commands, one of the first things to understand from scripting in SportsCode is how to select different elements from your code window and timeline to be used in your scripts. For example, if you want to display the number of shots by the home team together with the number of shots by the away team, you will want to translate that task into the appropriate script syntax that represents the calculation of “shots home team” + “shots away team” from your timeline. To do so, you will need to have the script select the appropriate elements from SportsCode that contain the shot numbers for either team, so that you can then add them together.

Below is a list of how to select an element from your code window or timeline to be used in your script commands.

Selecting Elements From Code Window

SportsCode Script Example:
Display the number of shots for the player appearing in the Button “PlayerName” by retrieving the button name with the name of the player and counting the events in the timeline with that name.

$

Creates a new variable to be used at a later stage in the script.

  • Examples:

    • $HomeGoals = count instances where row = “Home Goals”

    • $AwayGoals = count instances where row = “Away Goals”

    • $TotalGoals = $HomeGoals + $AwayGoals


$BUTTON_ID

Returns the button ID of the code button where the script is written.

Similar Command:
$THIS_BUTTON (returns the button name of the code button where the script is written)

  • Examples:

    • Show “This Code Button’s ID is “ + $BUTTON_ID


BUTTON NAME button_id

Retrieve a code button name using the button id of the button name you want to obtain.

  • Examples:

    • BUTTON NAME “Shots On Target”

    • BUTTON NAME “Home Goals”

    • BUTTON NAME “Away Goals”


CODE button_name

Selects the output from another button using the button’s name as reference (i.e. if button with the name Goals has a script that outputs 5, it will grab that number 5)

  • Examples:

    • CODE "Goals"

    • CODE “Total Shots”

    • CODE “Home Possession"


CODE ID

Selects the ID of a different button using that button’s name.

  • Examples:

    • CODE ID "Goals FC Barcelona"
      (if the button name “Goals FC Barcelona” has an ID called “Home Goals” it will return “Home Goals”)

    • CODE ID “Messi”
      (if the button with the name “Messi” has an ID called “Player” it will return the text “Player”)


BUTTON button_name STATE

Specifies whether a button in the code window is activated or not.

  • Examples:

    • SHOW BUTTON "FC Barcelona Possession" STATE
      (displays whether the possession button for Barcelona is activated or not)


Selecting Events From Timeline

SportsCode Script Example:
Display the total shots that took place in a match for both teams by first, counting the number of shot events in the timeline for each team inside a new variable and then adding the two team variables together by creating a third variable (i.e. $TotalShots) with the total.

ROW

Selects specific row within the timeline (i.e. Home Team Shots).

Similar Command:
ROW_NAME(#)
(Specifies the name of the row from the value you select, i.e. 1 = first row, 2 = second row)

  • Examples:

    • ROW = “Shots On Target”

    • ROW > 1

    • ROW < 10

    • ROW_NAME (1)
      (selects the name of the first row in the timeline)


INSTANCES

Selects specific events tracked within one or multiple rows in the timelines.

Similar Commands:
INSTANCES2
(only instances between red markers in timeline)
INSTANCE[X] (only the ‘x’th instance specified inside the brackets).

  • Examples:

    • INSTANCES WHERE ROW = “Shots On Target”

    • INSTANCES2 WHERE ROW = “Home Goals”

    • INSTANCES[2] WHERE ROW = “Away Goals”
      (selects the second goal by the Away team)


LABEL label_name

Select events with a specific a label in the timeline.

Similar Commands:
LABELS
(returns all labels)
LABEL IN (specific instances)
LABELS IN (all labels in specified instances)
”GROUP”.”LABEL” (selects events matching the group and label specified)
”GROUP”:”LABEL” (selects event occurrences matching the group and label specified)

  • Examples:

    • SHOW COUNT LABEL “On Target”

    • SHOW COUNT “On Target”

    • SHOW COUNT “On Target” WHERE ROW = “Home Team Shots” 

    • SHOW COUNT “ShotType”.“On Target” WHERE ROW = “Home Team Shots” 


FROM

If you are using multiple timelines, FROM allows you to specify which timeline to select events from.

  • Examples:

    • Show count instances from “Barcelona v Real Madrid” where row= “Barcelona Goals”
      (displays a total number of goals scored by Barcelona in the match against Real Madrid)

    • Show count “Messi” from “Barcelona v Real Madrid”, “Barcelona v Atletico” where row= “Barcelona Goals”
      (displays the total number of goals scored by Messi in the Barcelona matches against Real Madrid and Atletico.


GROUP

Selects all events with a specific group of labels.

  • Example:

    • Show count instances where group = "Shot"
      (displays the number of instances with labels in the group shot, i.e. with labels such as “On Target”, “Missed” or “Scored”)


LIMIT

Selects a specific instance or group of instances based on their position in the timeline.

  • Example:

    • Instances limit 2 where row= “Goals”
      (selects first 2 goal events from the timeline)

    • Instances limit 4,2 where row= “Fouls”
      (skips the first 4 fouls and selects the next 2)

    • Instances limit 4,-1 where row= “Free Kick”
      (skips the first 4 free kicks and selects all the remaining ones)

    • Instances limit -3,-2 where row= “Saves”
      (selects the second and third last saves)


OVERLAP

Selects events in the timeline that occur at the same time.

Similar Commands:
OVERLAP_LENGTH
(total length of time in second that two events or labels occur at the same time)
UNIQUE (opposite command to OVERLAP, returning events that occur at completely different times to other events)

  • Examples:

    • $MessiAssists = OVERLAP ( "Messi", "Assist" )
      (display the events with the label Messi and label Assist taking place at the same time)

    • Show start OVERLAP ("Scored" where row="Shot" ,"Messi" where row="Assist")
      (display start time of event when both the shot got scored and Messi assisted overlap)

    • $NotMessi = UNIQUE (“Shot”, “Messi”)
      (display the number of shots where Messi was not involved)


START

Select the earliest start time of the labels or instances in the timeline in seconds.

Similar Commands:
START TIME
(select events with a specific start time)
END (select the latest end time of the labels or instances in the timeline in seconds)
END TIME (select events with a specific end time)

  • Examples:

    • START "Goal"
      (display start time of first goal)

    • START "Messi" and "First Half" where row="Goal"
      (display the start time of Messi’s first goal in the first half)

    • Count instances where start time < 60
      (display the number of instances that occurred in the first 59 seconds)

    • END "Ball In Play"
      (display the latest time that the ball was in play)


RANGE

Select events based on when they occur in the timeline.

Similar Command:
HH:MM:SS
(select events based on when they occur using hours:minutes:second format)

  • Example:

    • Count instances where range > 60
      (display the number of events that happen after 60 seconds of play)

    • Count instances where range >= 60
      (display the number of events that happen from 60 seconds of play onwards)

    • Count instances where range != 60
      (display the number of events that happen before or after, but not at 60 seconds of play)

    • Show count instances where start time > 00:05:01.45
      (display the number of events that take place after 5 minutes and 1 second)


SportsCode Script Example:
Display the number of shots in the match that were on target by counting the number of events “Shot” but only those with the label “On Target” in them. Then display the result with a text in front with the message “Total Shots On Target” (i.e. Total Shots On Target 12”).


Commands To Set Conditions

These commands are used to create the logic of your selection. For example, if you want to select all shots in the first half, you may use the AND statement to make sure the scripts only considers the events of “shots” when the events “first half” is also true (i.e. shots AND first half). These commands can also be used for filtering specific events by name, using the WHERE statement (i.e. apply only WHERE an event name is “Shots”).


AND

Add additional true statements to your element selection logic. Used inside other commands. 

  • Example:

    • SHOW COUNT BUTTON NAME “Shots” AND BUTTON NAME “First Half”

    • SHOW COUNT $Away_Goals AND $Home_Goals

    • SHOW COUNT $PlayerOne AND $PlayerTwo


IF (condition, true, false)

Similarly to Excel, it conditions a the script or section of the script to whether the condition in the IF statement is true or false (i.e. IF Home Goals are higher than Away Goals then write “Home Win”, otherwise write “Draw/Loss”).

  • Examples:

    • IF ($AwayGoals < $HomeGoals, show “Home Win”, show “Draw/Loss”)


WHERE

Filtering by adding specific conditions (WHERE ROW = X)

  • Examples:

    • WHERE ROW = “Shots On Target”

    • WHERE ROW > 1

    • WHERE ROW < 10


NOT

Exclude an event or label from your selection.

  • Examples:

    • $Goals= NOT “Messi” show count $Goals
      (display all goals scored by all players BUT Messi)

    • $Cards = NOT “Red” show count $Cards
      (display all cards that are not red, therefore all yellow cards)


OR

Selects events or labels if either one of two conditions is met.

  • Examples:

    • $Goals= “Messi” OR “Suarez” show count $Goals
      (display all goals scored by either Messi or Suarez)

    • $Pass= NOT “Iniesta” OR “Xavi” show count $Pass
      (display all passes by players that are not Iniesta nor Xavi)


Commands To Display Outputs

Counts, percentages, ratios or even time metrics can be displayed in real-time in a code button within the code window. You can also display any text (known as string) by writing it with quotation marks (i.e. “Goals Scored”).

Similarly to Excel or a normal calculator, you can perform calculations inside your Script Editor of the code button and display the results. To do so, you simply add the operation after the word ‘show’ and the code button will display the result.

Scripting also allows you to display both text and numbers in one single code button. To do this, you will use a plus symbol (+) to join the text and the calculation results. This plus symbol allows you to join any text together with a number or other pieces of text. Any calculations will need to be written using parenthesis.


SHOWtext

Display text or/and numbers in a code button.

Similar Commands:
SHOW calculation
(add, subtract, divide or multiply any number and display the result in the code button , i.e. 2+2)
SHOW “text” + numbers (add a label before the number you want to display, i.e. shots = 5)

  • How it works:

    • Type the word show in your Script Editor panel.

    • Anything you type after “show” will be displayed in the code button.

  • Examples:

    • Show “Home Team”

    • Show “Shots On Target”

    • Show 2 + 2
      (the code button will display the number 4)

    • Show (5 – 2) * ( 4 – 1 )
      (displays the number 9)

    • Show “shots = “ + 5
      (displays ‘shots = 5’)

    • Show “goal difference = “ + (4 – 2)
      (displays ‘goal difference = 2’)

    • Show “Team scored “ + (1 + 2) + “goals”
      (displays ‘team scored 3 goals’)


TIMER (seconds, format)

Converts a time value that is in seconds to an hourly format.

Similar Command:
TIMER2
(converts a time value format from seconds to minutes)

  • Examples:

    • TIMER ( 3601.123,0 )
      (displays 1:00:01)

    • TIMER ( 3601.123,2 )
      (displays 1:00:01.12)

    • show TIMER ( 3601.123, "HH.mm.ss a" )
      (displays 01.00.01 AM)

    • TIMER2 ( 3601.123,2 )
      (displays 60:01.12)

SportsCode Script Example:
Display the % possession of each team by first, creating a variable that calculates the total length of time (in seconds) each team had the ball, and then creating a third variable that divides the length of time for a particular team by the total length of time that both teams had the ball. Display the results by removing the decimal points and adding the % sign as text after the calculation result.


Commands To Run Calculations

COUNT

Counts the number of labels in the timeline, even if they appear multiple times in one event.

  • Examples:

    • COUNT “Messi”

    • COUNT “Messi” where row = “FC Barcelona Goals”

    • COUNT “Missed” where row = “Home Team Shots”


LENGTH

Calculates the length of time (in seconds) of the event labels or instances in the timeline.

  • Example:

    • LENGTH “Home Possession”

    • LENGTH “Home Possession” IN ROW = “Ball In Play”

    • LENGTH “Home Possession” IN ROW = “First Half” OR “Second Half”


ROUND (#, digits)

Rounds a number to the specified number of digits from the decimal point.

Similar Commands:
DECIMAL (#, digits)
(rounds down a number to the specified number of digits from the decimal point, returning it as a string)
FLOOR (#, digits) (rounds down a number to the specified number of digits from the decimal point, returning it as a number)
CEILING (#, digits) (rounds a number up to the nearest decimal point)
ABS (#) (converts a number into its absolute value by removing all decimals)

  • Examples:

    • show ROUND (34.235, 2)

    • show ROUND (3423.456, -2)

    • show DECIMAL ( ROUND(0.499,0) ,2)

    • show CEILING (34.23001, 2)


TIME

Selects the events with a specific length of time.

  • Examples:

    • Count instances where time < 60
      (counts the number of instances shorter than 60 seconds)

    • Count "Counterattack" where row="Possession" and time < 30
      (counts the counterattacks of less than 30 seconds)


Commands To Change Formatting & Appearance

SportsCode Script Example:
Create a shot frequency map using toggle buttons of player name that, when pressed, change the name of a separate button. This button is then used as the reference for all six buttons in the pitch location map to count the number of shots for the selected player for each position of the pitch using two types of labels: player name and shot location. The % of each location is then calculated with these counts. Lastly, an IF statement changes the colour of the button based on the % calculated by setting a different colour for different ranges.

BUTTON COLOR

Changes the background colour of the current button.

Similar Command:
SEND BUTTON COLOR
(changes the background colour of a different button)

  • Examples:

    • BUTTON COLOR (100,0,0)
      (red)

    • BUTTON COLOR "FC Barcelona"
      (changes the background colour of the current button to that from the button named "FC Barcelona"

    • SEND BUTTON COLOR (100,0,0) TO BUTTON "Manchester Utd"
      (changes the background colour of the button “Manchester Utd” to red)


TEXT COLOR

Changes the text colour in the name of the button.

Similar Command:
SEND TEXT COLOR
(changes the text colour in a different button)

  • Examples:

    • TEXT COLOR (100,0,0)
      (red)

    • SEND TEXT COLOR (100,0,0) TO BUTTON "Manchester Utd"
      (changes the colour of the text in the “Manchester Utd” button to red)


BUTTON OPACITY

Changes the opacity of the current button

  • Examples:

    • BUTTON OPACITY 50
      (50% visible)

    • BUTTON OPACITY 0
      (hides button)


MOVE BUTTON BACK

Arranges the button so that it moves to the back of the code window not to overlap with other buttons.

Similar Command:
MOVE BUTTON FRONT
(moves button to the front over other code buttons)

  • Examples:

    • MOVE BUTTON BACK

    • MOVE BUTTON FRONT


OUTPUT COLOR

Changes the text colour of the output from the button’s script.

  • Examples:

    • OUTPUT COLOR (100,0,0) changes the output color of the text to red.


 Commands To Perform Actions


PUSH BUTTON button_name UP

Activates or deactivates a button.

Similar Commands:
PUSH BUTTON button_name DOWN
(pushes a specific button down)
PUSH BUTTON UP WITH DELAY(pushes current button up after a specified delay in seconds)
PUSH BUTTON DOWN WITH DELAY (pushes current button down after a specified delay in seconds)
PUSH BUTTON UP (pushes the current button up)
PUSH BUTTON DOWN (pushes the current button down)

  • Examples:

    • PUSH BUTTON "name1" DOWN

    • PUSH BUTTON "name1" UP IN WINDOW "window1"

    • PUSH BUTTON DOWN WITH DELAY 0.2


RENAME new_button_name

Renames the current button.

Similar Commands:
RENAME GROUP new_group_name
(renames the group name for the current button)
SEND value TO BUTTON button_name (changes the button name of a different button to the specified value)

  • Example:

    • RENAME "Atletico Possession"

    • RENAME GROUP "Away Team"

    • SEND "FC Barcelona" TO BUTTON "Home Team"
      (renames the button with ID “Home Team” to be called “FC Barcelona”)


OPEN

Check whether a timeline is currently open in SportsCode.

Similar Command:
NOT OPEN
(check whether a timeline is currently not open in SporstCode)

  • Examples:

    • IF ("FC Barcelona v Real Madrid" open, show "YES")
      (display the text "YES" if the timeline is open)


A New Way Of Classifying Team Formations In Football

One of the most important tactical decisions made in football is deciding on the best team formation,  determining what roles each player has and the playing style. Laurie Shaw and Mark Glickman from the Department of Statistics at Harvard University recently developed an innovative, data-driven way of identifying different tendencies seen by managers when giving tactical instructions to their players, specifically around team formations. They measured and classified 3,976 observations of different spatial configurations of players on the pitch for teams with and without the ball. They then analysed the changes of these formations throughout the course of a match.

 While team formations in football have evolved over the years, they continue to heavily rely on a classification system that simply counts the number of defenders, midfielders and forwards (i.e. 4-3-3). However, Laurie and Mark argued that this system only provides a crude summary of player configurations within a team, ignoring the fluidity and nuances these formations may experience during specific circumstances of a match. For instance, when Jürgen Klopp prepares his formations at Liverpool, he creates a defensive version where all players know their roles and an offensive one that aims to exploit the best areas of the pitch. Therefore, Liverpool prepare different formations for different phases of the game; a detail that is lost when describing them as using a simple 4-3-3 formation.

Identifying Defensive And Offensive Formations

The researchers used tracking data to make multiple observations of team formations in the 100 matches analysed; separating formations with and without possession. By doing so, they identified a unique set of formations that are most frequently used by teams. These groups helped them classify new formation observations to then analyse major tactical transitions during the course of a match.

Source: Shaw, L. &amp; Glickman, M. (2019) Dynamic analysis of team strategy in professional football. Barça Sports Analytics Summit.

Source: Shaw, L. & Glickman, M. (2019) Dynamic analysis of team strategy in professional football. Barça Sports Analytics Summit.

The above diagram from Laurie and Mark’s study shows a defending team moving as a coherent block by having players retain their relative position, showing that their formation is not defined by the positions of players on the pitch in absolute terms but by their positions relative to one another. Starting from the player in the densest part of the team, Laurie and Mark calculated the relative position of each player using the average angle and distance between said player and his nearest neighbour over a specific time period in a match, and subsequently repeating the same process with the latter’s neighbor and so on. By calculating the average vectors between all pairs of players in the team, they obtained a center of mass of a team’s formation, which is then aligned to the centre of the pitch when plotting team formations.

Source: Shaw, L. &amp; Glickman, M. (2019) Dynamic analysis of team strategy in professional football. Barça Sports Analytics Summit.

Source: Shaw, L. & Glickman, M. (2019) Dynamic analysis of team strategy in professional football. Barça Sports Analytics Summit.

The researchers made multiple observations of a team’s defensive and offensive configurations throughout the match. They aggregated together the observed possession into two-minute intervals. For example, for the team in possession they plotted all possessions into two-minutes time periods and then measured their formations in each of those sets, and did the same process for the team without possession during the same time period.

The diagram below shows a set of formation observations for a team during a single match, illustrating that the team defends with a 4-1-4-1 formation, but attacks with three forwards and with the fullbacks aligning with the defensive midfielder. These findings also illustrate that while the defensive players remained compacted, the movement of attacking players, such as central striker was more varied. The consistency in all the observations also suggest that the managers did not change formations significantly during the match. 

Source: Shaw, L. &amp; Glickman, M. (2019) Dynamic analysis of team strategy in professional football. Barça Sports Analytics Summit.

Source: Shaw, L. & Glickman, M. (2019) Dynamic analysis of team strategy in professional football. Barça Sports Analytics Summit.

Grouping Similar Formations Together Into Five Clusters

Additionally, Laurie and Mark used an agglomerative hierarchical clustering to identify unique sets of formations that teams used in the 100 matches analysed; constituting 1,988 observations of defensive formations and 1,988 observations of offensive ones. To be able to group formations together, they first had to define a metric that established the level of similarity between two separate formations. The similarity between two players in two different formations is quantified using the Wasserstein distance, using their two bivariate normal distributions, with their own means and covariance matrix, where the Wassertein distance between them is calculated by squaring the L2 norm of the difference between their means. However, an entire team’s formation consists on a set of 10 bivariate normal distributions, one for each outfield player. Therefore, to compare two different team formations the researchers calculated the minimum cost of moving from one distribution to another using the total Wasserstein distance. The blue area in the diagram below indicates the number of players that deviate from the formation’s average position.

Laurie and Mark also found that two formations may be identical in shape, but one may be more compact than the other. In order to classify formations solely by shape and not by their degree of expansion across the pitch, they had to scale the formations so that compactness is no longer a discriminator in their clustering.

Once this was resolved, the hierarchical clustering applied to the dataset simply found two most similar formation observations based on the Wasserstein distance metric to combine them and form a group. Then, it found the next two most similar ones, forming more groups, and so on. This process identified 5 groups of formations with each group containing 4 variant formations, producing a total of 20 unique formations.

Source: Shaw, L. &amp; Glickman, M. (2019) Dynamic analysis of team strategy in professional football. Barça Sports Analytics Summit.

Source: Shaw, L. & Glickman, M. (2019) Dynamic analysis of team strategy in professional football. Barça Sports Analytics Summit.

 The first group of formations correspond to 17% of all observations in the sample of Laurie and Mark’s study. The commonality of these four variants in the first group of formations is that there are five defenders, but with variations in the number of midfielders and forwards. This group of formations was most predominant in defensive situations, with between 73%-88% of their observations being of teams without possession.

Sports Performance Analysis - Team Formations
Source: Shaw, L. &amp; Glickman, M. (2019) Dynamic analysis of team strategy in professional football. Barça Sports Analytics Summit.

Source: Shaw, L. & Glickman, M. (2019) Dynamic analysis of team strategy in professional football. Barça Sports Analytics Summit.

Group 2 and Group 3 share the commonality of having 4 defenders, with group two in the second row consisting of more compact midfields, as oppose to a more expanded midfield in Group 3 formations.

Source: Shaw, L. &amp; Glickman, M. (2019) Dynamic analysis of team strategy in professional football. Barça Sports Analytics Summit.

Source: Shaw, L. & Glickman, M. (2019) Dynamic analysis of team strategy in professional football. Barça Sports Analytics Summit.

Group 4 contained predominantly attacking formations consisting on three defenders, where the wingbacks push high up the pitch, and with variations in structure of the midfield and forward line.

Source: Shaw, L. &amp; Glickman, M. (2019) Dynamic analysis of team strategy in professional football. Barça Sports Analytics Summit.

Source: Shaw, L. & Glickman, M. (2019) Dynamic analysis of team strategy in professional football. Barça Sports Analytics Summit.

Group 5 formations contained two defenders with fullbacks pushed up the field and with some variations in the forward line with either two or three forwards, as well as different structures on the midfield. These group of formations consistent entirely in offensive formations observations.

As illustrated by these groupings, the hierarchical clustering Laurie and Mark applied was very efficient in separating offensive and defensive formation observations, even after excluding the dimension of the area of the formation (i.e. how compact the formations are) as a discriminator. Additionally, while some of these formations aligned with traditional ways to describe formations, such as 4-4-2 or 4-1-4-1, others do not clearly fall within these historical classifications. Once the formation clusters were identified, the researchers developed a basic model selection algorithm to categorise any new formation observations into any of these groups by finding the maximum likelihood cluster.

Transitions Between Offensive And Defensive Formations

Laurie and Mark took their research a step forward by evaluating the pairing tendencies by coaches of the various defensive and offensive formations. In the diagram below, they illustrated that the teams that defend with Cluster 2 frequently transition into an offensive formation like the one in Cluster 16, with the wingbacks pushing up. Also, half of the teams with the defensive formation in Cluster 9 tend to use the offensive formation in Cluster 10, while the other half transition to a formation similar to Cluster 18. This demonstrated a clear story in to how a player transitions from their defensive role to their attacking role. Moreover, it showed that some defensive formations allow more variety in terms of the offensive formations than others.

Source: Shaw, L. &amp; Glickman, M. (2019) Dynamic analysis of team strategy in professional football. Barça Sports Analytics Summit.

Source: Shaw, L. & Glickman, M. (2019) Dynamic analysis of team strategy in professional football. Barça Sports Analytics Summit.

Tactical Match Analysis Through This Methodology

The methodology developed by Laurie and Mark allows teams to measure and detect significant changes in formations throughout the match. They were able to produce diagrams such as the one below to illustrate the formation changes in both defensive (diamonds) and offensive (circles), including annotations of goals (top lines) and substitutions (bottom lines). The story of the match in the diagram shows a red team conceding a goal in the first half and then making a significant tactical change at half time as well as a substitution. Laurie and Mark found this situation very usual, as whenever there was a major tactical change it was often accompany with a substitution. Comparing with other matches, they found that this particular red team made major tactical changes at half time in around a quarter of their matches, providing insights into how their manager reacts to given situations.

Source: Shaw, L. &amp; Glickman, M. (2019) Dynamic analysis of team strategy in professional football. Barça Sports Analytics Summit.

Source: Shaw, L. & Glickman, M. (2019) Dynamic analysis of team strategy in professional football. Barça Sports Analytics Summit.

In another diagram, they demonstrated how their methodology can also help study how changes in formation begin impact the outcome of a match. In this match, the blue team were predominantly attacking down the wings in the first half, with most of their high quality opportunities coming from right wing. In the second half, the red team changed their formation to five defenders instead of four, which reduced the attacks from the blue team’s right wing and instead going through the centre, presumably less busy since they now have two midfielders rather than three.

Source: Shaw, L. &amp; Glickman, M. (2019) Dynamic analysis of team strategy in professional football. Barça Sports Analytics Summit.

Source: Shaw, L. & Glickman, M. (2019) Dynamic analysis of team strategy in professional football. Barça Sports Analytics Summit.

Finally, this methodology also allows teams to establish the link between chance creation and formation structure. They can also measure how different the position of opposing players is from their preferred defensive structure (i.e. how are are they out of position). At the same time, it allows for the measurement of the level of attacking threat by assessing the amount of high value territory the attacking team controls near the defending team’s goal. These pitch control models enable the measurement of threatening positions even when no shot took place. Laurie and Mark suggest that this kind of analysis allows teams to better understand how the attacking team maneuvers defenders out of their positions or how they take advantage defending team being out of position after a high press or a counterattack.

Citations:

  • Shaw, L. & Glickman, M. (2019) Dynamic analysis of team strategy in professional football. Barça Sports Analytics Summit. Link to paper

Automated Tracking Of Body Positioning Using Match Footage

A team of imaging processing experts from the Universitat Pompeu Fabra in Barcelona have recently developed a technique that identifies a player’s body orientation on the field within a time series simply by using video feeds of a match of football. Adrià Arbués-Sangüesa, Gloria Haro, Coloma Ballester and Adrián Martín (2019) leveraged computer vision and deep learning techniques to develop three vector probabilities that, when combined, estimated the orientation of a player’s upper-torso using his shoulder and hips positioning, field view and ball position.

This group of researchers argue that due to the evolution of football orientation has become increasingly important to adapt to the increasing pace of the game. Previously, players often benefited from sufficient time on the ball to control, look up and pass. Now, a player needs to orientate their body prior to controlling the ball in order to reduce the time it takes him to perform the next pass. Adrià and his team defined orientation as the direction in which the upper body is facing, derived by the area edging from the two shoulders and the two hips. Due to their dynamic and independent movement, legs, arms and face were excluded from this definition.  

Sports Performance Analysis - OpenPose

To produce this orientation estimate, they first calculated different estimates of orientation based on three different factors: pose orientation (using OpenPose and super-resolution for image enhancing), field orientation (the field view of a player relative to their position on the field) and ball position (effect of ball position on orientation of a player). These three estimates were combined together by applying different weightings and produce the final overall body orientation of a player.

1. Body Orientation Calculated From Pose

The researchers used the open source library of OpenPose. This library allows you to input a frame and retrieve a human skeleton drawn over an image of a person within that frame. It can detect up to 25 body parts per person, such as elbows, shoulders and knees, and specify the level of confidence in identifying such parts. It can also provide additional data points such as heat maps and directions.

However, unlike in a closeup video of a person, in sports events like a match of football players can appear in very small portions of the frame, even in full HD frames like broadcasting frames. Adrià and team solved this issue by upscaling the image through super-resolution, an algorithmic method to image resolution by extracting details from similar images in a sequence to reconstruct other frames. In their case, the researcher team applied a Residual Dense Network model to improve the image quality of faraway players. This deep learning image enhancement technique helped researchers preserve some image quality and detect the player’s faces through OpenPose thanks to the clearer images. They were then able to detect additional points of the player’s body and accurately define the upper-torso position using the points of the shoulders and hips.

Source: Arbues-Sangüesa, A.; Haro, G.; Ballester C. &amp; Martin A. (2019) Head, Shoulders, Hip and Ball... Hip and Ball! Using Pose Data to Leverage Football Player Orientation. Barça Sports Analytics Summit.

Source: Arbues-Sangüesa, A.; Haro, G.; Ballester C. & Martin A. (2019) Head, Shoulders, Hip and Ball... Hip and Ball! Using Pose Data to Leverage Football Player Orientation. Barça Sports Analytics Summit.

Once the issue with image quality was solved by researchers and the player’s pose data was then extracted through OpenPose, the orientation in which a player was facing was derived by using the angle of the vector extracted from the centre point of the upper-torse (shoulders and hips area). OpenPose provided the coordinates of both shoulders and both hips, indicating the position of these specific points in a player’s body relative to each other. From these 2D vectors, researchers could determine whether a player was facing right or left using the x and y axis of the shoulder and hips coordinates. For example, if the angle of the shoulders shown in OpenPose is 283 degrees with a confidence of 0.64, while the angle of the hips is 295 degrees with a confidence level of 0.34, researchers will use the shoulders’ angle to estimate the orientation of the player due to its higher confidence level. In cases where a player is standing parallel to the camera and the angles of either the hips or the shoulders are impossible to establish as they are all within the same coordinate in the frame, then researchers used the facial features (nose, eyes and ears) as a reference to a player’s orientation, using the neck as the x axis.

Source: Arbues-Sangüesa, A.; Haro, G.; Ballester C. &amp; Martin A. (2019) Head, Shoulders, Hip and Ball... Hip and Ball! Using Pose Data to Leverage Football Player Orientation. Barça Sports Analytics Summit.

Source: Arbues-Sangüesa, A.; Haro, G.; Ballester C. & Martin A. (2019) Head, Shoulders, Hip and Ball... Hip and Ball! Using Pose Data to Leverage Football Player Orientation. Barça Sports Analytics Summit.

This player and ball 2D information was then projected into the football pitch footage showing players from the top to see their direction. Using the four corners of the pitch, researchers could reconstruct a 2D pitch positioning that allowed them to match pixels from the footage of the match to the coordinates derived from OpenPose. Therefore, they were now able to clearly observe whether a player in the footage was going left or right as derived by their model’s pose results.

Source: Arbues-Sangüesa, A.; Haro, G.; Ballester C. &amp; Martin A. (2019) Head, Shoulders, Hip and Ball... Hip and Ball! Using Pose Data to Leverage Football Player Orientation. Barça Sports Analytics Summit.

Source: Arbues-Sangüesa, A.; Haro, G.; Ballester C. & Martin A. (2019) Head, Shoulders, Hip and Ball... Hip and Ball! Using Pose Data to Leverage Football Player Orientation. Barça Sports Analytics Summit.

In order to achieve the right level of accuracy in exchange for precision, researchers clustered similar angles to create a total of 24 different orientation groups (i.e. 0-15 degree, 15-30 degrees and so on), as there was not much difference in having a player face an angle of 0 degrees or 5 degrees.

 2. Body Orientation Calculated From Field View Of A Player

Researchers then quantified field orientation of a player by setting the player’s field of view during a match to around 225 degrees. This value was only used as a backup value in case of everything else fails, since it was a least effective method to derive orientation as the one previously described. The player’s field of view was transformed into probability vectors with values similar to the ones with pose orientation that are based on y coordinates. For example, a right back on the side of the pitch will have its field of view reduced to about 90 degrees, as he is very unlikely to be looking outside of the pitch.

Source: Arbues-Sangüesa, A.; Haro, G.; Ballester C. &amp; Martin A. (2019) Head, Shoulders, Hip and Ball... Hip and Ball! Using Pose Data to Leverage Football Player Orientation. Barça Sports Analytics Summit.

Source: Arbues-Sangüesa, A.; Haro, G.; Ballester C. & Martin A. (2019) Head, Shoulders, Hip and Ball... Hip and Ball! Using Pose Data to Leverage Football Player Orientation. Barça Sports Analytics Summit.

3. Orientation Calculated From Ball Positioning

The third estimation of player orientation was related to the position of the ball on the pitch. This assumed that players are affected by their relative position in relation to the ball, where players closer to the ball are more strongly oriented towards it while the orientation of players further away from it may be less impacted by the ball position. This step of player orientation based on ball position accounts for the relative effect of ball position. Each player is not only allocated a particular angle in relation to the ball but also a specific distance to it, which is converted into probability vectors.

Source: Arbues-Sangüesa, A.; Haro, G.; Ballester C. &amp; Martin A. (2019) Head, Shoulders, Hip and Ball... Hip and Ball! Using Pose Data to Leverage Football Player Orientation. Barça Sports Analytics Summit.

Source: Arbues-Sangüesa, A.; Haro, G.; Ballester C. & Martin A. (2019) Head, Shoulders, Hip and Ball... Hip and Ball! Using Pose Data to Leverage Football Player Orientation. Barça Sports Analytics Summit.

Combination Of All The Three Estimates Into A Single Vector

Adrià and the research team contextualized these results by combining all three estimates into as single vector by applying different weights to each metric. For instance, they found that field of view corresponded to a very small proportion of the orientation probability than the other two metrics. The sum of all the weighted multiplications and vectors from the three estimates will correspond to the final player orientation, the final angle of the player. By following the same process for each player and drawing their orientation onto the image of the field, player movements can be tracked during the duration of the match while the remain on frame.

In terms of the accuracy of the method, this method managed to detect at least 89% of all required body parts for players through OpenPose, with the left and right orientation rate achieving a 92% accuracy rate when compared with sensor data. The initial weighting of the overall orientation became 0.5 for pose, 0.15 for field of view and <0.5 for ball position, suggesting the pose data is the highest predictor of body orientation. Also, field of view was the least accurate one with an average error of 59 degrees and could be excluded altogether. Ball orientation performs well in estimating orientation but pose orientation is a stronger predictor in relation to the degree of error. However, the combination of all three outperforms the individual estimates.

Some limitations the researchers found in their approach is the varying camera angles and video quality available by club or even within teams of the same club. For example, matches from youth teams had poor quality footage and camera angles making it impossible for OpenPose to detect players at certain times, even when on screen.  

Source: Arbues-Sangüesa, A.; Haro, G.; Ballester C. &amp; Martin A. (2019) Head, Shoulders, Hip and Ball... Hip and Ball! Using Pose Data to Leverage Football Player Orientation. Barça Sports Analytics Summit.

Source: Arbues-Sangüesa, A.; Haro, G.; Ballester C. & Martin A. (2019) Head, Shoulders, Hip and Ball... Hip and Ball! Using Pose Data to Leverage Football Player Orientation. Barça Sports Analytics Summit.

Finally, Adrià et al. suggest that video analysts could greatly benefir from this automated orientation detection capability when analyzing match footage by having directional arrows printed on the frame that facilitate the identification of cases where orientation can be critical to develop a player or a particular play. The highly visual aspect of the solution makes is very easily understood by players when presenting them with information about their body positioning during match play, for both first team and the development of youth players. This metric could also be incorporated into the calculation of the conditional probability of scoring a goal in various game situations, such as its inclusion during modeling of Expected Goals. Ultimately, these innovative advances in automatic data collection can relief many Performance Analyst from hours of manual coding of footage when tracking match events.

Citations:

Arbues-Sangüesa, A.; Haro, G.; Ballester C. & Martin A. (2019) Head, Shoulders, Hip and Ball... Hip and Ball! Using Pose Data to Leverage Football Player Orientation. Barça Sports Analytics Summit. Link to article.